Clouded Judgement 7.29.22
Every week I’ll provide updates on the latest trends in cloud software companies. Follow along to stay up to date!
Cloud Giants
We now have the reports from all the hyperscalers (Amazon, Google and Microsoft). Results have been quite good:
AWS (Amazon): $79B run rate, growing 33% YoY (last Q growth was 37%)
Azure (Microsoft): ~$55B run rate, growing 46% YoY (last Q grew 49%)
Google Cloud (includes GSuite): $25B run rate, growing 36% YoY (last Q grew 44%, but neither are constant currency).
Impressive! Consensus estimates for AWS growth was 31.7%, so it was a nice beat. After both the Azure and AWS reports, many other public infrastructure companies rallied (Snowflake, Datadog, Mongo, etc). In the past there has been a fairly consistent read-through of the hyperscalers results to other cloud infra players. While I still expect that to be true in Q2, that correlation may start to deteriorate. The hyperscalers have the benefit of offering massive platforms that are made up of many smaller “point solutions.” The benefit to someone like Microsoft in the current environment, is many companies, in an effort to cut costs, are likely to consolidate individual vendor spend of these point solutions to the equivalent service at Microsoft. The bar has been raised for other infra companies, and when they report we’ll see if the AWS / Azure / GCP strength was idiosyncratic to the hyperscalers, or more indicative of the broader market.
GDP Update
Yesterday we got the Q2 GDP results - GDP contracted 0.9% (annualized) in the quarter off of expectations of +0.4% growth. Well, we now have 2 quarters of GDP contraction. Generally, this is thought of as a recession. However, the white house has been clear recently that there’s more to a recession than just 2 quarters of negative GDP growth. There’s definitely truth to this. Last quarter, GDP was negative largely due to net trade. Consumption (one element of GDP) was +2.7% in Q1. I wrote more about this here. This quarter, GDP contracted largely due to decreases in inventories (inventories helped boost GDP in 2021). Consumer spending (personal consumption) grew 1%. Spending on services accelerated to 4.1%, but this was offset by a decline in non-durable goods of 5.5% and durable goods of 2.6%. Net net - there are still elements of Q2 GDP that looks better than the headline negative figure would imply. So are we in a recession? If we’re not there yet, it sure does feel imminent.
IF we are in a recession, it’s a weird one. More of a white collar recession. Unemployment is still very low. For some businesses it’s hard to differentiate if poor performance is a Covid hangover or more recession forced. Apple announced a great quarter yesterday. Tricky waters to navigate…
Rates Update
The Fed raised the fed funds rate 75bps on Wednesday (as expected). The current target is 2.25% - 2.5%. Interestingly, they signaled that this is now a “neutral rate.” This just means a fed funds rate of 2.25-2.5% is neither expansionary or contractionary. Some very very smart people disagree with this take (have to click the link to see second tweet in the thread):

Interestingly, after the Q2 GDP print came out on Thursday, the 10Y fell. It’s currently ~2.65%, which is meaningfully down from it’s recent high of ~3.5% from a little over a month ago. What does this tell us? Probably 2 things. Most importantly, the market doesn’t believe the Fed is leading us to a place of sustained high rates (let’s call “high” >4%). Whether that’s right or wrong, we’ll have to wait and see. Related, it also tells us the market believes the Fed either won’t need to raise rates (and keep them high) to combat inflation, or they won’t be willing to raise rates into the teeth of a recession (which looks more and more imminent). Some are even calling for rate cuts in the back half of 2023. What would trigger rate cuts? Weaning inflation, and a recession. The tricky part - hard to say if inflation does actually wane next year. I believe it will, but I’m no expert.
Quick Multiples Update
The current median multiple is 6.3x and the 10Y is 2.65%
The long term average cloud software multiple is 7.8x, and the average 10Y in that period was 2.3%
In general you can expect ~15-20% multiple contraction for every 1% rise in the 10Y. Just looking at the numbers, this would imply that multiples are too low relative to their long term average. However, as I’ve discussed before, the market is baking in earnings revisions going into a recession, and it’s unclear if the 10Y is really where it should be.
Quarterly Reports Summary
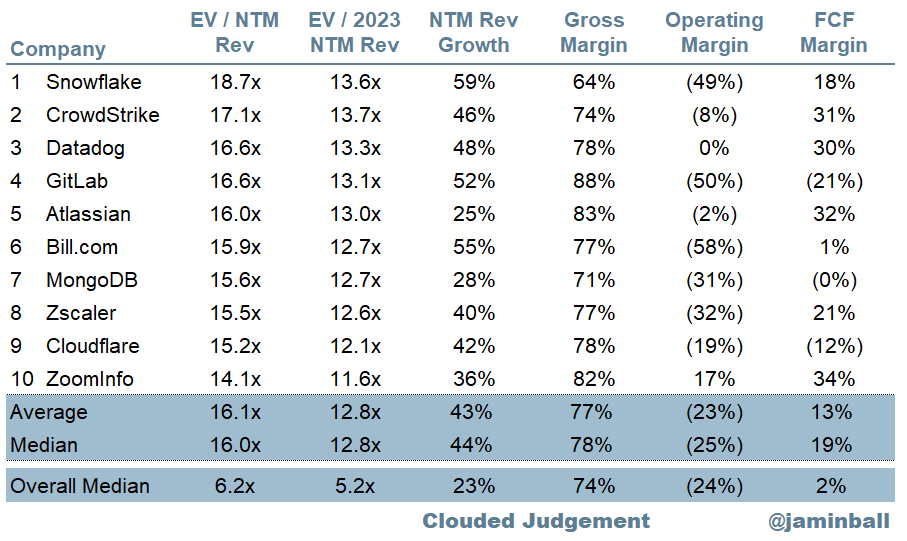
Top 10 EV / NTM Revenue Multiples
Top 10 Weekly Share Price Movement
Update on Multiples
SaaS businesses are valued on a multiple of their revenue - in most cases the projected revenue for the next 12 months. Multiples shown below are calculated by taking the Enterprise Value (market cap + debt - cash) / NTM revenue.
Overall Stats:
Overall Median: 6.2x
Top 5 Median: 16.6x
10Y: 2.7%
Bucketed by Growth. In the buckets below I consider high growth >30% projected NTM growth, mid growth 15%-30% and low growth <15%
High Growth Median: 8.8x
Mid Growth Median: 6.7x
Low Growth Median: 3.6x
Scatter Plot of EV / NTM Rev Multiple vs NTM Rev Growth
How correlated is growth to valuation multiple?
Growth Adjusted EV / NTM Rev
The below chart shows the EV / NTM revenue multiple divided by NTM consensus growth expectations. The goal of this graph is to show how relatively cheap / expensive each stock is relative to their growth expectations
Operating Metrics
Median NTM growth rate: 23%
Median LTM growth rate: 32%
Median Gross Margin: 74%
Median Operating Margin (24%)
Median FCF Margin: 2%
Median Net Retention: 120%
Median CAC Payback: 36 months
Median S&M % Revenue: 46%
Median R&D % Revenue: 27%
Median G&A % Revenue: 20%
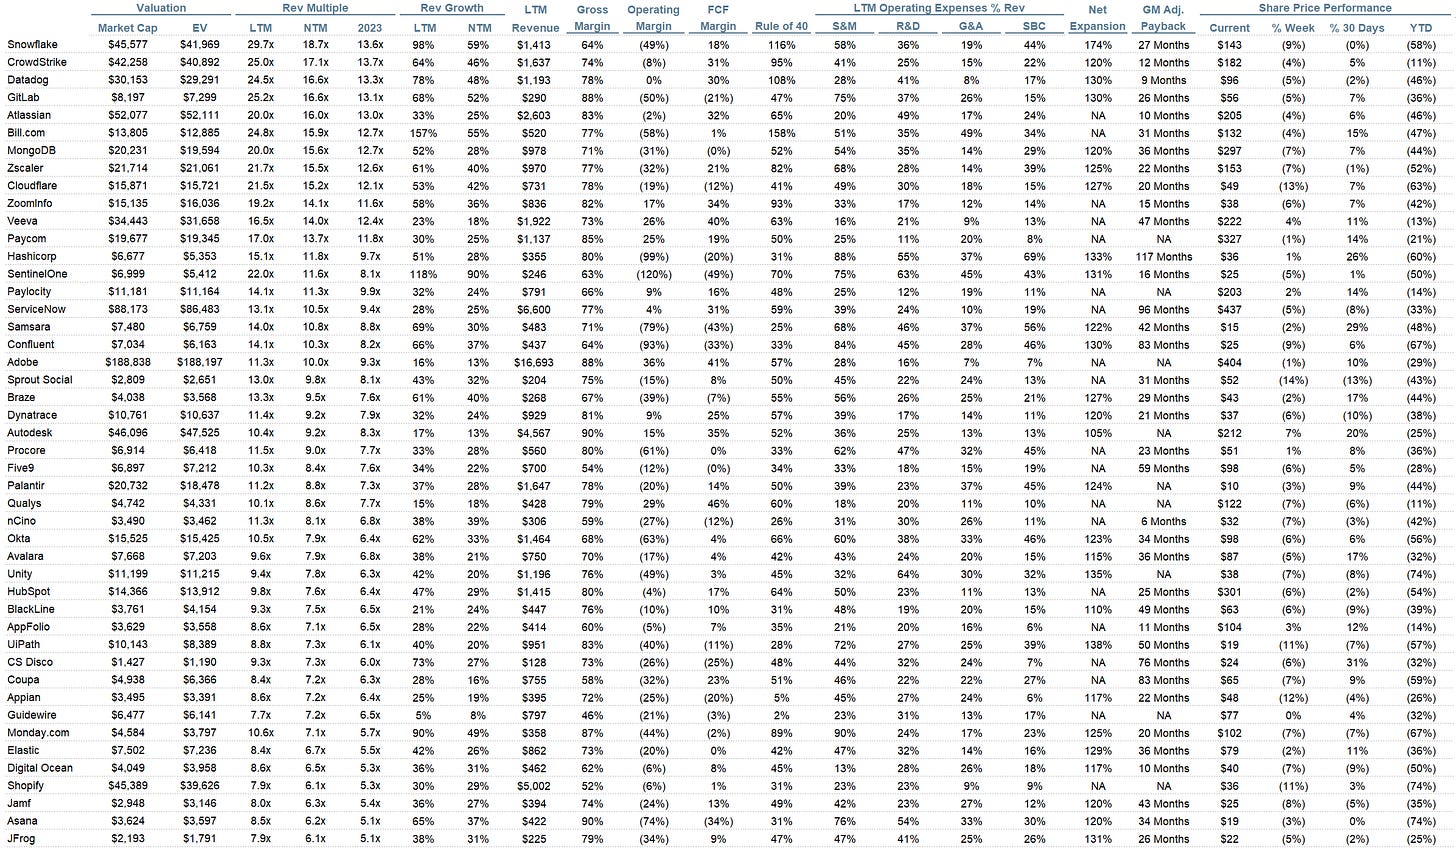
Comps Output
Rule of 40 shows LTM growth rate + LTM FCF Margin. FCF calculated as Cash Flow from Operations - Capital Expenditures
GM Adjusted Payback is calculated as: (Previous Q S&M) / (Net New ARR in Q x Gross Margin) x 12 . It shows the number of months it takes for a SaaS business to payback their fully burdened CAC on a gross profit basis. Most public companies don’t report net new ARR, so I’m taking an implied ARR metric (quarterly subscription revenue x 4). Net new ARR is simply the ARR of the current quarter, minus the ARR of the previous quarter. Companies that do not disclose subscription rev have been left out of the analysis and are listed as NA.
This post and the information presented are intended for informational purposes only. The views expressed herein are the author’s alone and do not constitute an offer to sell, or a recommendation to purchase, or a solicitation of an offer to buy, any security, nor a recommendation for any investment product or service. While certain information contained herein has been obtained from sources believed to be reliable, neither the author nor any of his employers or their affiliates have independently verified this information, and its accuracy and completeness cannot be guaranteed. Accordingly, no representation or warranty, express or implied, is made as to, and no reliance should be placed on, the fairness, accuracy, timeliness or completeness of this information. The author and all employers and their affiliated persons assume no liability for this information and no obligation to update the information or analysis contained herein in the future.


Gotta say, Twilio looks particularly cheap when you consider the Rev/EV multiple, expansion rate and growth rate....Am I missing something here? Lower gross margin could be the reason for lower valuation.