Clouded Judgement 8.11.23 - Datadog Consumption Trends
Every week I’ll provide updates on the latest trends in cloud software companies. Follow along to stay up to date!
Datadog Consumption
This week we got another earnings report from a key consumption player: Datadog’s Q2. On the surface, it wasn’t good. They narrowly beat estimates for Q2, and then guided Q3 below consensus. On top of that, they took down their full year guide by 2% from where they guided after Q1. Another way to look at this is despiteh Q2 coming in above their guide, they took down their full year guide. This means the outlook for Q3 and Q4 is came down quite a bit. Does this mean optimization headwinds are getting stronger? Not quite… The earnings call gave us more detail, and painted a more positive picture than just the numbers may suggest. The weakness they called out was from larger cloud-native businesses. The good news is gross retention (ie churn) stayed constant. But these larger customers expanded at a slower clip, and this was the primary driver for reducing the full year guide.
Now for the good news - they called out seeing the light at the end of the tunne;L
“On the other hand, we are seeing signs that the cloud optimization across our customer base may start to subside. The cohort of customers who began optimizing about a year ago appear to have stabilized the users growth at the end of Q2, as indicated by the recent activity and the related commitments with us. And we saw usage growth in aggregates rebound in July to levels that are more similar to what we see in Q1. While it is too early to call an end to cloud optimization and a significant level of macro uncertainty remains, these new trends, along with the tenor of our customer interactions are encouraging.”
The impact they saw was from existing larger customers. However, they called out strength when looking at new business (ie net new customer signups). “New logo and new product bookings and deal cycles haven't been impacted by the period of optimization and we continue to see healthy growth on the sales side. From a new logo bookings perspective, we had our largest Q2 and second largest quarter ever, only behind the seasonally larger Q4 2022.” It’s really important that new business is still healthy, and a sign of overall market health.
The question remains - when will we see new customers ramping workloads, and existing customers optimizing less. Existing customers always go through a cycle of expansion to optimization to expansion to optimization (rinse repeat). We’re currently in a heavy cycle of optimization. From their commentary, it sounds like once customers start optimizing, that period lasts about a year (they called out the cohort of customers who started optimizing a year ago are stabilizing). However, not everyone started optimizing a year ago. I’d guess most companies started their optimization journey in the Q3 ‘22 to Q1 ‘23 window. With the largest cohort (from # customers) probably being Q4 ‘22 (just a guess). That would imply we’ll still see headwinds of optimizations through the rest of this year. Q1 ‘24 may be the first quarter thins “get better” as most companies get through their optimization journey. I’d guess the cohort of customers who started optimizing 1 year ago represent <50% of overall customers, so the cohorts still optimizing are greater than the cohorts that are through optimizations.
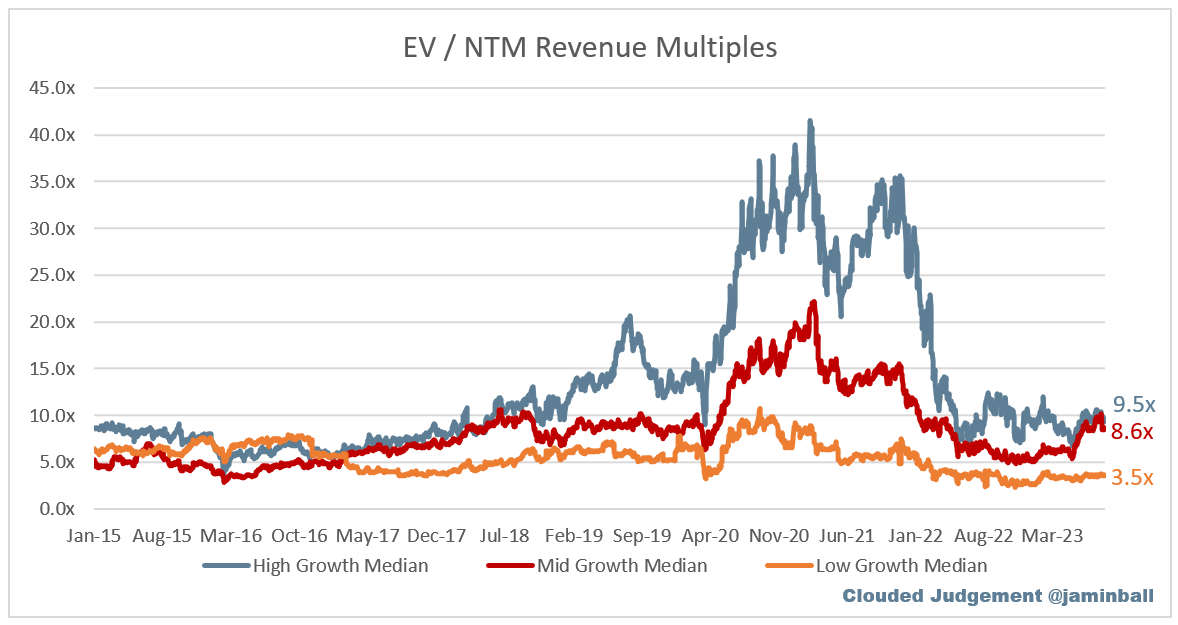
This is all important because on a relative basis, high growth software is expensive. While the overall median revenue multiple of the software universe is ~6x (which is ~25% below the long term average of ~8x), high growth software is currently trading at a premium to it’s long term average (9.4x vs 9.3x). The growth of this high growth cohort is also lower than it’s been in the past. So on a growth adjusted basis, high growth software is expensive. Why? People are hiding out waiting for re-acceleration that comes when optimization headwinds subside. The question is how patient will they be waiting for this? I think market can look forward 2-3 quarters, but we’re getting tight on that window. If next quarter we get similar commentary that Azure gave us this quarter (“still a couple quarters away” without any specific guidance), then we may see market loose a little patience.
Overall we’re seeing signs of improvement, but not nearly out of the woods yet. I thought Q1 was going to be the worst quarter for software with marginal improvements in Q2, but so far Q2 hasn’t been great. The chart below shows the percent of companies who’ve beat guidance (ie guided Q3 ahead of consensus), and the median % raise. As you can see, less companies are guiding ahead of consensus this quarter than last, and the median guide dropped down below 0% again (ie median company is guiding Q3 below consensus). The broadly was a reversal from the trend in Q1.
I’m hopeful we’re getting leading indicators that the light at the end of the tunnel is getting closer. However, it’s not showing up in the data yet. And everyone hoping for AI acceleration will need to wait. The hyperscalers (AWS, Azure, GCP) are seeing some uptick, but this is largely from selling compute (ie cloud GPUs). Private companies like CoreWeave and Lambda (who offer cloud GPUs) are also seeing a big boost. Confluent, Datadog, Snowflake, Mongo don’t have the same luxury :) Microsoft also gave specific commentary that they don’t expect Office Copilot revenue to really kick in until first half of 2024. In summary, I don’t expect real AI tailwinds to show up in non-hyperscaler businesses in a meaningful way through the rest of 2023. So a re-acceleration effort will not be gifted to us in the form of AI
Quarterly Reports Summary
Top 10 EV / NTM Revenue Multiples
Top 10 Weekly Share Price Movement
Update on Multiples
SaaS businesses are generally valued on a multiple of their revenue - in most cases the projected revenue for the next 12 months. Revenue multiples are a shorthand valuation framework. Given most software companies are not profitable, or not generating meaningful FCF, it’s the only metric to compare the entire industry against. Even a DCF is riddled with long term assumptions. The promise of SaaS is that growth in the early years leads to profits in the mature years. Multiples shown below are calculated by taking the Enterprise Value (market cap + debt - cash) / NTM revenue.
Overall Stats:
Overall Median: 6.0x
Top 5 Median: 14.4x
10Y: 4.0%
Bucketed by Growth. In the buckets below I consider high growth >30% projected NTM growth, mid growth 15%-30% and low growth <15%
High Growth Median: 9.5x
Mid Growth Median: 8.6x
Low Growth Median: 3.5x
EV / NTM Rev / NTM Growth
The below chart shows the EV / NTM revenue multiple divided by NTM consensus growth expectations. So a company trading at 20x NTM revenue that is projected to grow 100% would be trading at 0.2x. The goal of this graph is to show how relatively cheap / expensive each stock is relative to their growth expectations
EV / NTM FCF
Companies with negative NTM FCF are not listed on the chart
Scatter Plot of EV / NTM Rev Multiple vs NTM Rev Growth
How correlated is growth to valuation multiple?
Operating Metrics
Median NTM growth rate: 15%
Median LTM growth rate: 23%
Median Gross Margin: 75%
Median Operating Margin (18%)
Median FCF Margin: 6%
Median Net Retention: 115%
Median CAC Payback: 47 months
Median S&M % Revenue: 44%
Median R&D % Revenue: 27%
Median G&A % Revenue: 17%
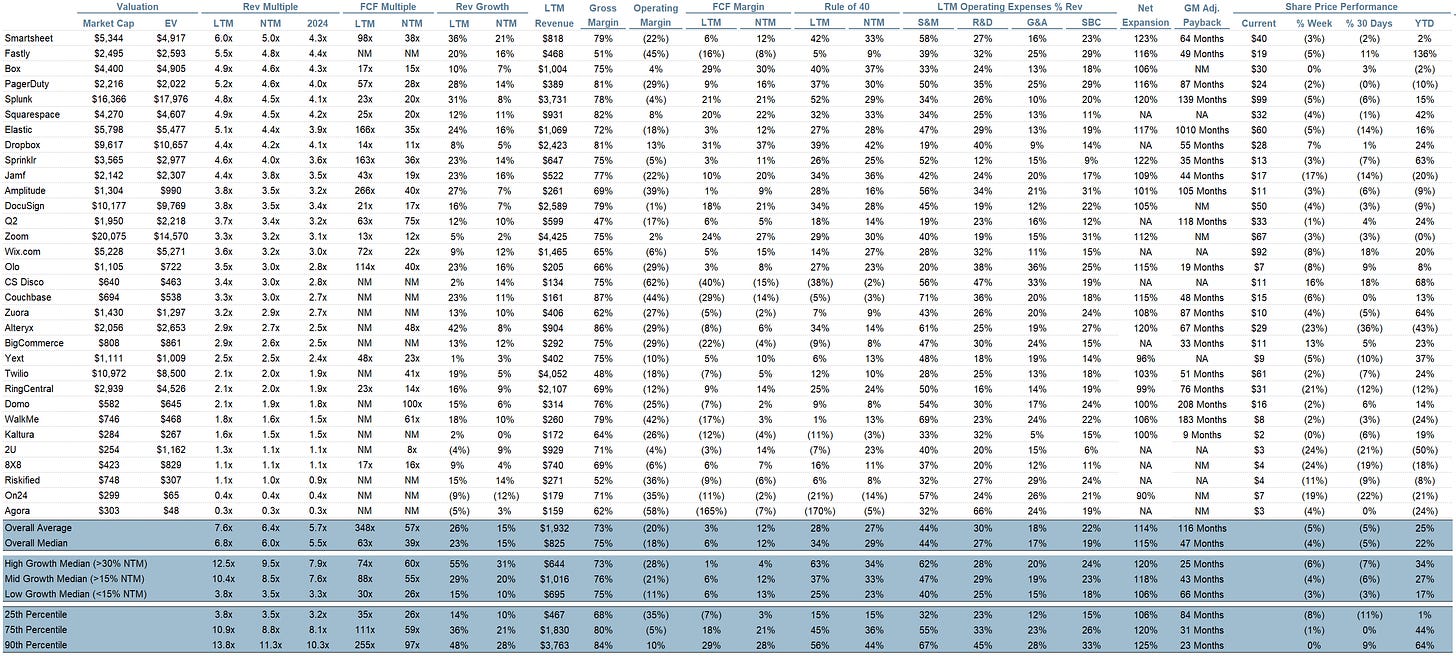
Comps Output
Rule of 40 shows rev growth + FCF margin (both LTM and NTM for growth + margins). FCF calculated as Cash Flow from Operations - Capital Expenditures
GM Adjusted Payback is calculated as: (Previous Q S&M) / (Net New ARR in Q x Gross Margin) x 12 . It shows the number of months it takes for a SaaS business to payback their fully burdened CAC on a gross profit basis. Most public companies don’t report net new ARR, so I’m taking an implied ARR metric (quarterly subscription revenue x 4). Net new ARR is simply the ARR of the current quarter, minus the ARR of the previous quarter. Companies that do not disclose subscription rev have been left out of the analysis and are listed as NA.
This post and the information presented are intended for informational purposes only. The views expressed herein are the author’s alone and do not constitute an offer to sell, or a recommendation to purchase, or a solicitation of an offer to buy, any security, nor a recommendation for any investment product or service. While certain information contained herein has been obtained from sources believed to be reliable, neither the author nor any of his employers or their affiliates have independently verified this information, and its accuracy and completeness cannot be guaranteed. Accordingly, no representation or warranty, express or implied, is made as to, and no reliance should be placed on, the fairness, accuracy, timeliness or completeness of this information. The author and all employers and their affiliated persons assume no liability for this information and no obligation to update the information or analysis contained herein in the future.


