Clouded Judgement 8.12.22
Every week I’ll provide updates on the latest trends in cloud software companies. Follow along to stay up to date!
Market Thoughts
The last 2 months have been quite interesting. I got a push notification on my phone Wednesday evening about a WSJ article with the text “The Nasdaq surged 2.9% [today] and entered a bull market, up at least 20% from a recent low. The rise ended the longest bear market since 2008.” And just like that everything looks great! All is not well, however… While technically this may be true, I don’t think anyone would argue we’re really at the start of a new bull market. Many on twitter were quick to point out that in the dot com crash from 2000 to 2002 the Nasdaq rose 20% 7 separate times on its ultimate path to bottoming. However, the current bear market rally we’re in today (~40 trading days) is longer than all 7 bear market rallies from the dot com crash (haven’t actually fact checked this yet, but I got this data from this tweet). So is this bear market rally more than just a bear market rally?? It’s dizzying to try and make sense of what’s going on, but I think everything boils down to 2 main questions. 1: Will we enter a recession? 2: Has inflation peaked, and is Fed doing enough. On point 1 - the labor market continues to be quite strong. We’ve had 2 negative GDP prints, but one was driven by net exports, and the other by inventories. Personal consumption is still growing. For software companies, Q2 earnings so far have been better than feared. Yes results / guides are on the light end, but there’s increasing comfort that software may in fact prove to be more resilient than feared. On point 2 - The inflation question matters because it directly impacts rates. On Wednesday we got a lighter CPI print than anticipated, potentially suggesting inflation has peaked.
What’s so difficult about these two questions is the answer is not binary to either. Maybe inflation has peaked, but what if it stays sticky around 4-5%, prompting higher rate hikes? If we do go into a recession, will it be a deep one or more of a technical recession? It’s so hard to predict! Either way, market positioning has changed significantly in the last 2 months. And to be clear - the market is not always right. But it’s sending a clear signal on what’s being probability weighted today. A soft landing went from impossible to “maybe Jerome might just get it done!” The surprise (to the downside) of the recent CPI report (8.5% headline vs 8.7% expectations, and 5.9% core vs 6.1% expectations) added fuel to this school of thought. Bears will say inflation will be sticky due to rents (these are very sticky). And while housing prices appear to have peaked and are coming down, there’s generally a ~12 month lag until this shows up in the CPI data. Will wage growth stabilize in the interim to avoid a wage price spiral? That’s the key question.
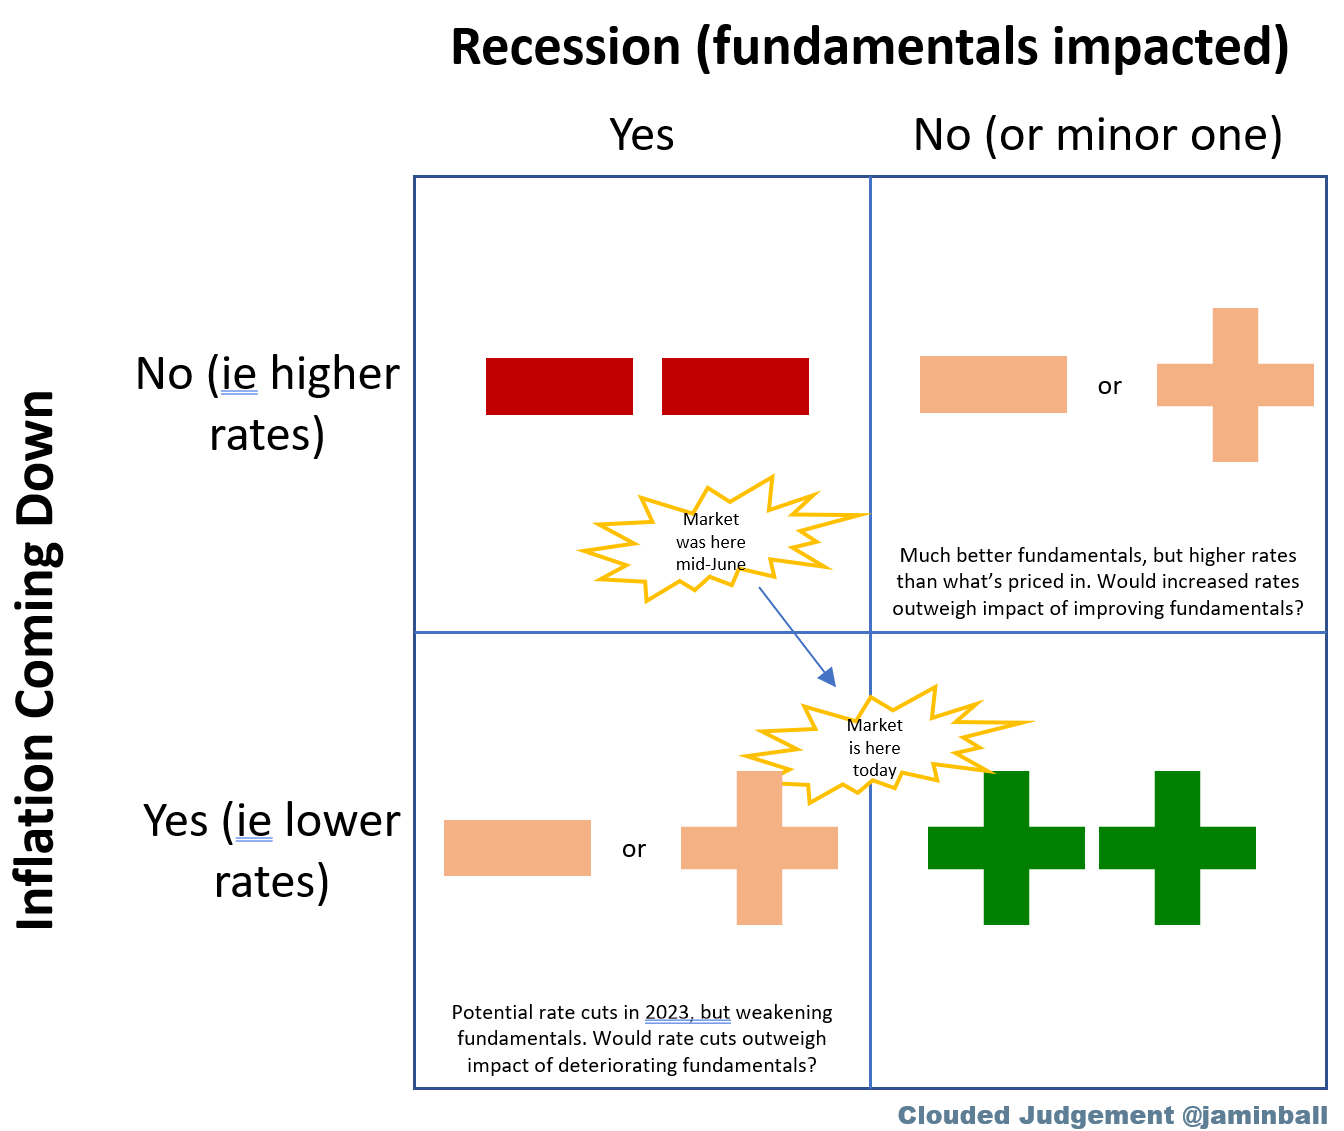
If I had to summarize the market sentiment shift over the last 2 months it’s two fold - software stocks did better than feared so far in Q2 reports, and incremental data (CPI) suggests Fed may not have to go as high with rate hikes. Time will tell if this sentiment shift was accurate. The bond market is now pricing in rate cuts in 2023 which would be a boost for stocks (source tweet). the 10Y is 2.9%, which isn’t that different from it’s average from 2010 - 2020 (2.4%) when software stocks preformed quite well. I tried to summarize all of this in a 2x2 matrix below. Inside each quadrant is what I believe would happen to software stocks
Based on the data we have today, I think the market is being too optimistic. There really isn’t much room for error on both the near term for rate hikes, or the near term for recession risks (or any evidence for weakening fundamentals when companies report with July quarter ends). But just like the Fed, I’m going to be data dependent on my commentary here :) One thing I didn’t discuss is how “offside” the market is currently if the Fed does thread the needle on a soft landing. As we got more evidence that this was maybe possible, there was a lot of positioning shifts that drove markets higher (more technical, but some algo short covering essentially)
If I had to pick a quadrant today I’d guess we end up in the lower left quadrant of my graphic above. I don’t think we’re in a recession yet but I do think one is coming, probably in 2023.
Quarterly Reports Summary
Top 10 EV / NTM Revenue Multiples
Top 10 Weekly Share Price Movement
Update on Multiples
SaaS businesses are valued on a multiple of their revenue - in most cases the projected revenue for the next 12 months. Multiples shown below are calculated by taking the Enterprise Value (market cap + debt - cash) / NTM revenue.
Overall Stats:
Overall Median: 7.3x
Top 5 Median: 21.0x
10Y: 2.9%
Bucketed by Growth. In the buckets below I consider high growth >30% projected NTM growth, mid growth 15%-30% and low growth <15%
High Growth Median: 11.6x
Mid Growth Median: 6.6x
Low Growth Median: 3.3x
Scatter Plot of EV / NTM Rev Multiple vs NTM Rev Growth
How correlated is growth to valuation multiple?
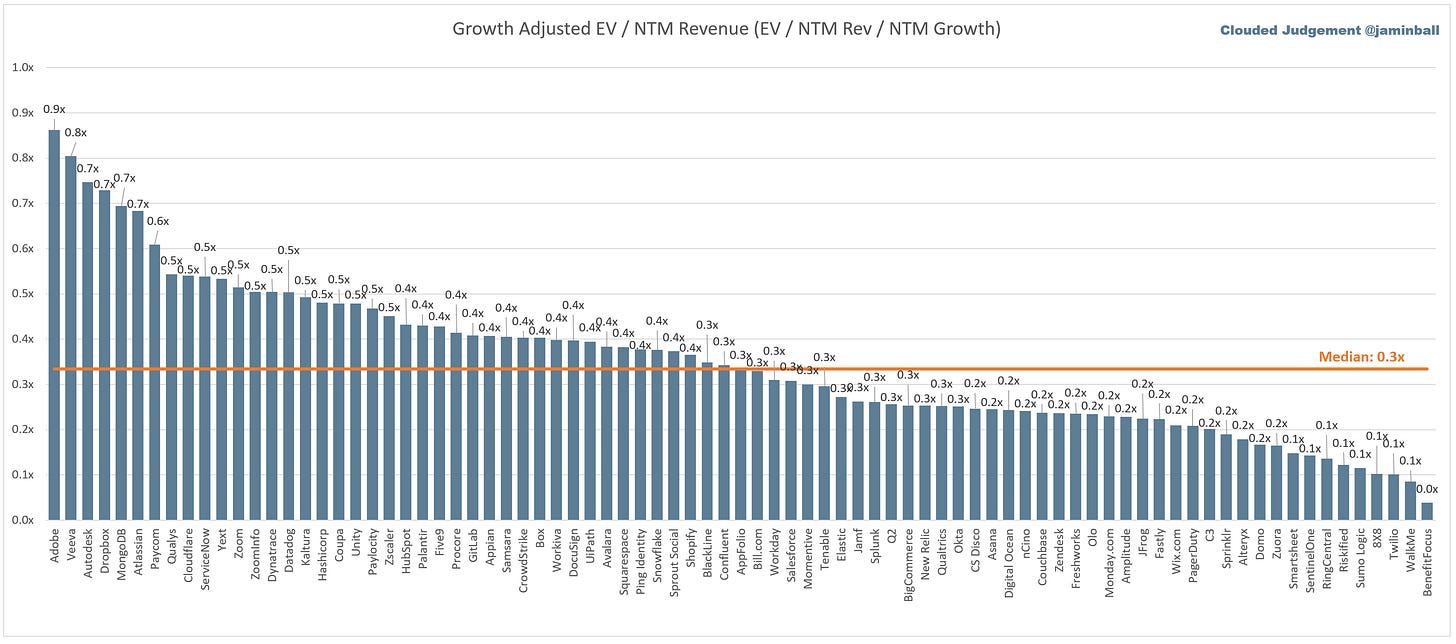
Growth Adjusted EV / NTM Rev
The below chart shows the EV / NTM revenue multiple divided by NTM consensus growth expectations. The goal of this graph is to show how relatively cheap / expensive each stock is relative to their growth expectations
Operating Metrics
Median NTM growth rate: 22%
Median LTM growth rate: 31%
Median Gross Margin: 74%
Median Operating Margin (25%)
Median FCF Margin: 1%
Median Net Retention: 120%
Median CAC Payback: 35 months
Median S&M % Revenue: 47%
Median R&D % Revenue: 28%
Median G&A % Revenue: 20%
Comps Output
Rule of 40 shows LTM growth rate + LTM FCF Margin. FCF calculated as Cash Flow from Operations - Capital Expenditures
GM Adjusted Payback is calculated as: (Previous Q S&M) / (Net New ARR in Q x Gross Margin) x 12 . It shows the number of months it takes for a SaaS business to payback their fully burdened CAC on a gross profit basis. Most public companies don’t report net new ARR, so I’m taking an implied ARR metric (quarterly subscription revenue x 4). Net new ARR is simply the ARR of the current quarter, minus the ARR of the previous quarter. Companies that do not disclose subscription rev have been left out of the analysis and are listed as NA.
This post and the information presented are intended for informational purposes only. The views expressed herein are the author’s alone and do not constitute an offer to sell, or a recommendation to purchase, or a solicitation of an offer to buy, any security, nor a recommendation for any investment product or service. While certain information contained herein has been obtained from sources believed to be reliable, neither the author nor any of his employers or their affiliates have independently verified this information, and its accuracy and completeness cannot be guaranteed. Accordingly, no representation or warranty, express or implied, is made as to, and no reliance should be placed on, the fairness, accuracy, timeliness or completeness of this information. The author and all employers and their affiliated persons assume no liability for this information and no obligation to update the information or analysis contained herein in the future.


Well done, this is my first time get a very strong argument.. Keep it up