
Clouded Judgement 8.15.25 - The Return of Software

Every week I’ll provide updates on the latest trends in cloud software companies. Follow along to stay up to date!
The Return of Software
There are two debates in AI that I’m sure will keep coming back for years. The first is “who has the best model.” Every new release brings a round of cheering for a new leader, but sooner or later that leader is passed, and the cycle repeats.
The second is whether AI will kill software as we know it. That conversation flared up about a year ago, faded, and is now back again.
My view hasn’t changed: software will have to evolve, but it’s certainly not dead. Business models will shift. Orgs will need to adapt. But the core idea of building a product, shipping it broadly, evolving it, and capturing value through usage isn’t going away.
We’ve been here before. The rise of the cloud was supposed to spell the end for on-prem software. It didn’t. On-prem didn’t disappear, there are still plenty of on prem software companies and deployments today! Software has a long half-life and rarely dies overnight.
The durability comes from more than just the “record” in a system of record. The real value is in the workflows that touch it. Those workflows can number in the hundreds, spreading into sales, finance, support, billing, compliance, and a tangle of custom tools. These tentacles are difficult to replace, and companies are hesitant to try. Break one connection and you risk customer-facing impact, which is not a gamble most teams want to take.
Even if you could “vibe code” a drop-in replacement, you still face the hard part: maintaining the core system and all of its tentacles over time. That means upgrades, security reviews, uptime guarantees, and endless support for edge cases. Most companies aren’t in the business of managing internal software, they’re in the business of serving their customers. Diverting resources to build and maintain internal systems that aren’t mission-critical is often a costly distraction.
That’s not to say all software is safe. There’s a long tail of point solutions that can and will be replaced by AI-driven tools. Many of these never had a strong long-term position to begin with. But the products that own core workflows and deep integrations should endure, provided they embrace AI themselves.
The danger is that the long half-life of software can mask decline. A product can look stable while slowly losing relevance, only for the damage to become obvious years later. Ignoring AI accelerates that decay. The only real defense is to integrate AI into the product, use it to improve workflows, shorten time-to-value, and make those tentacles even more valuable.
The “best model” debate will keep cycling through winners. The “is software dead” debate will keep resurfacing. In the meantime, the software that adapts - the kind that owns key records, orchestrates critical workflows, and evolves with the tools around it, will keep compounding.
Quarterly Reports Summary

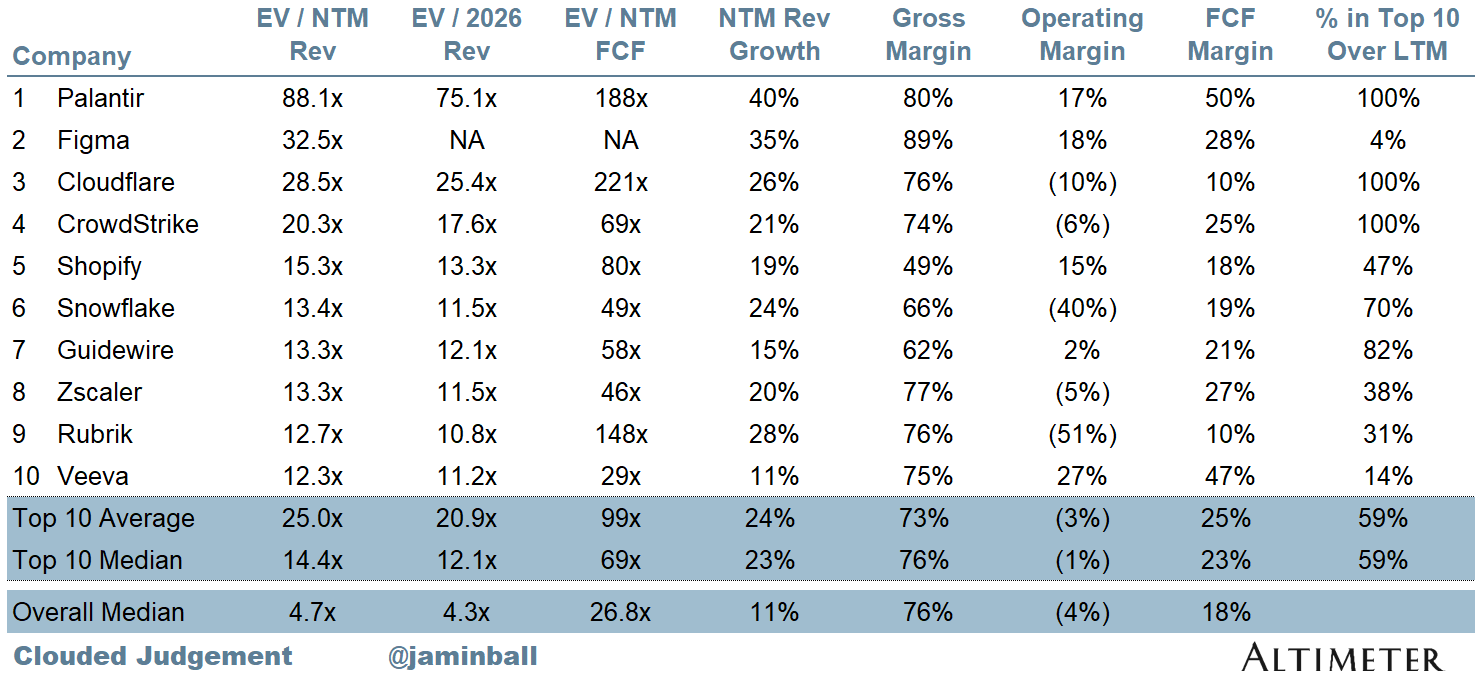
Top 10 EV / NTM Revenue Multiples
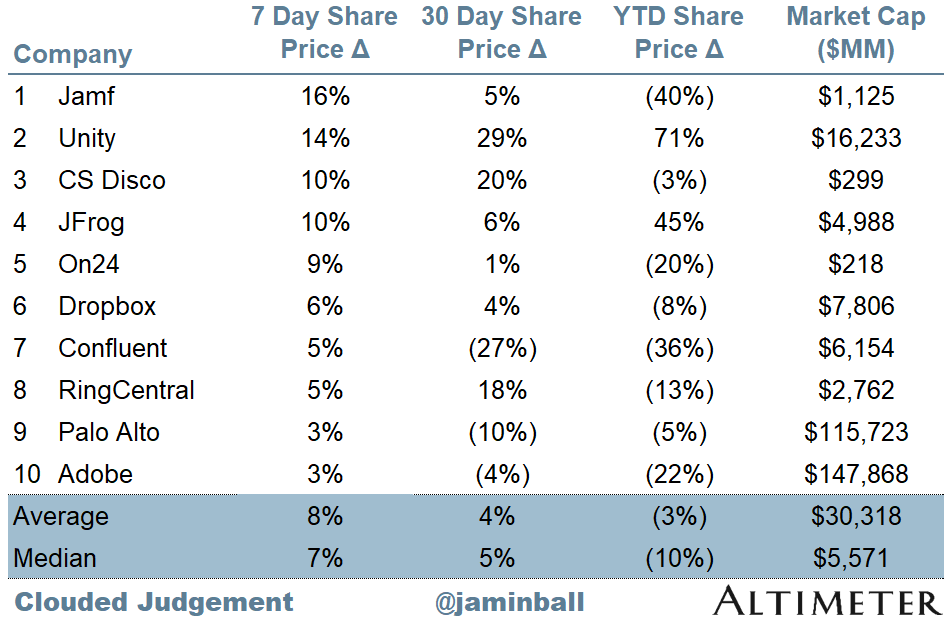
Top 10 Weekly Share Price Movement
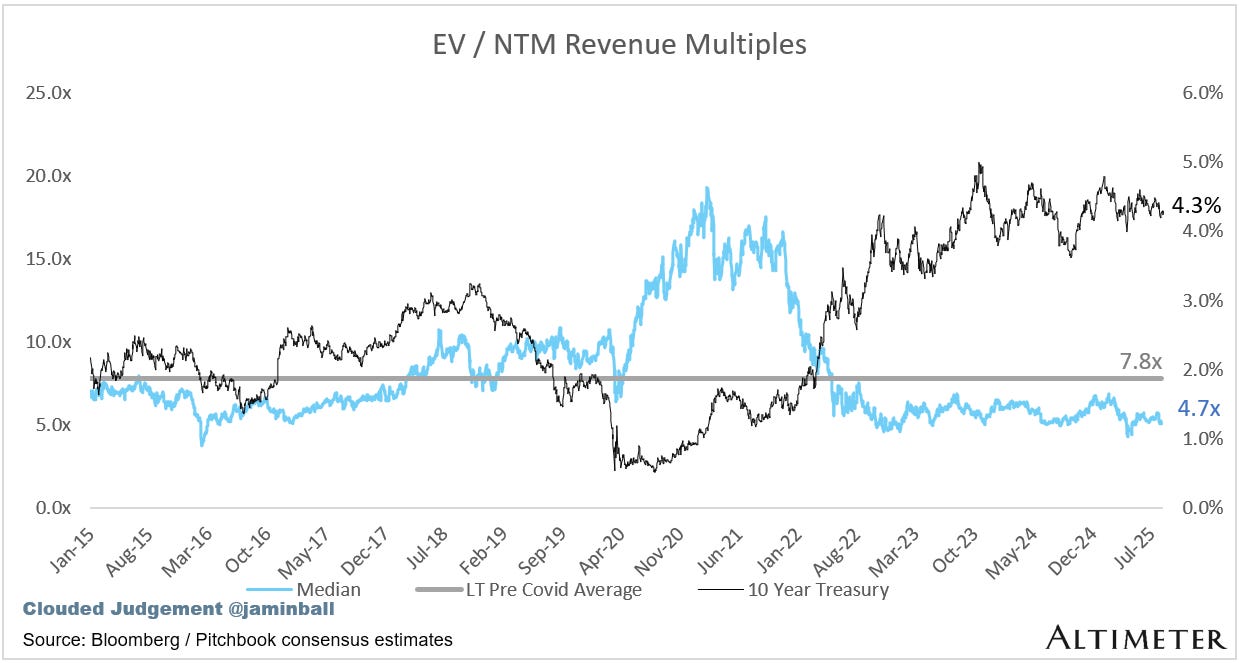
Update on Multiples
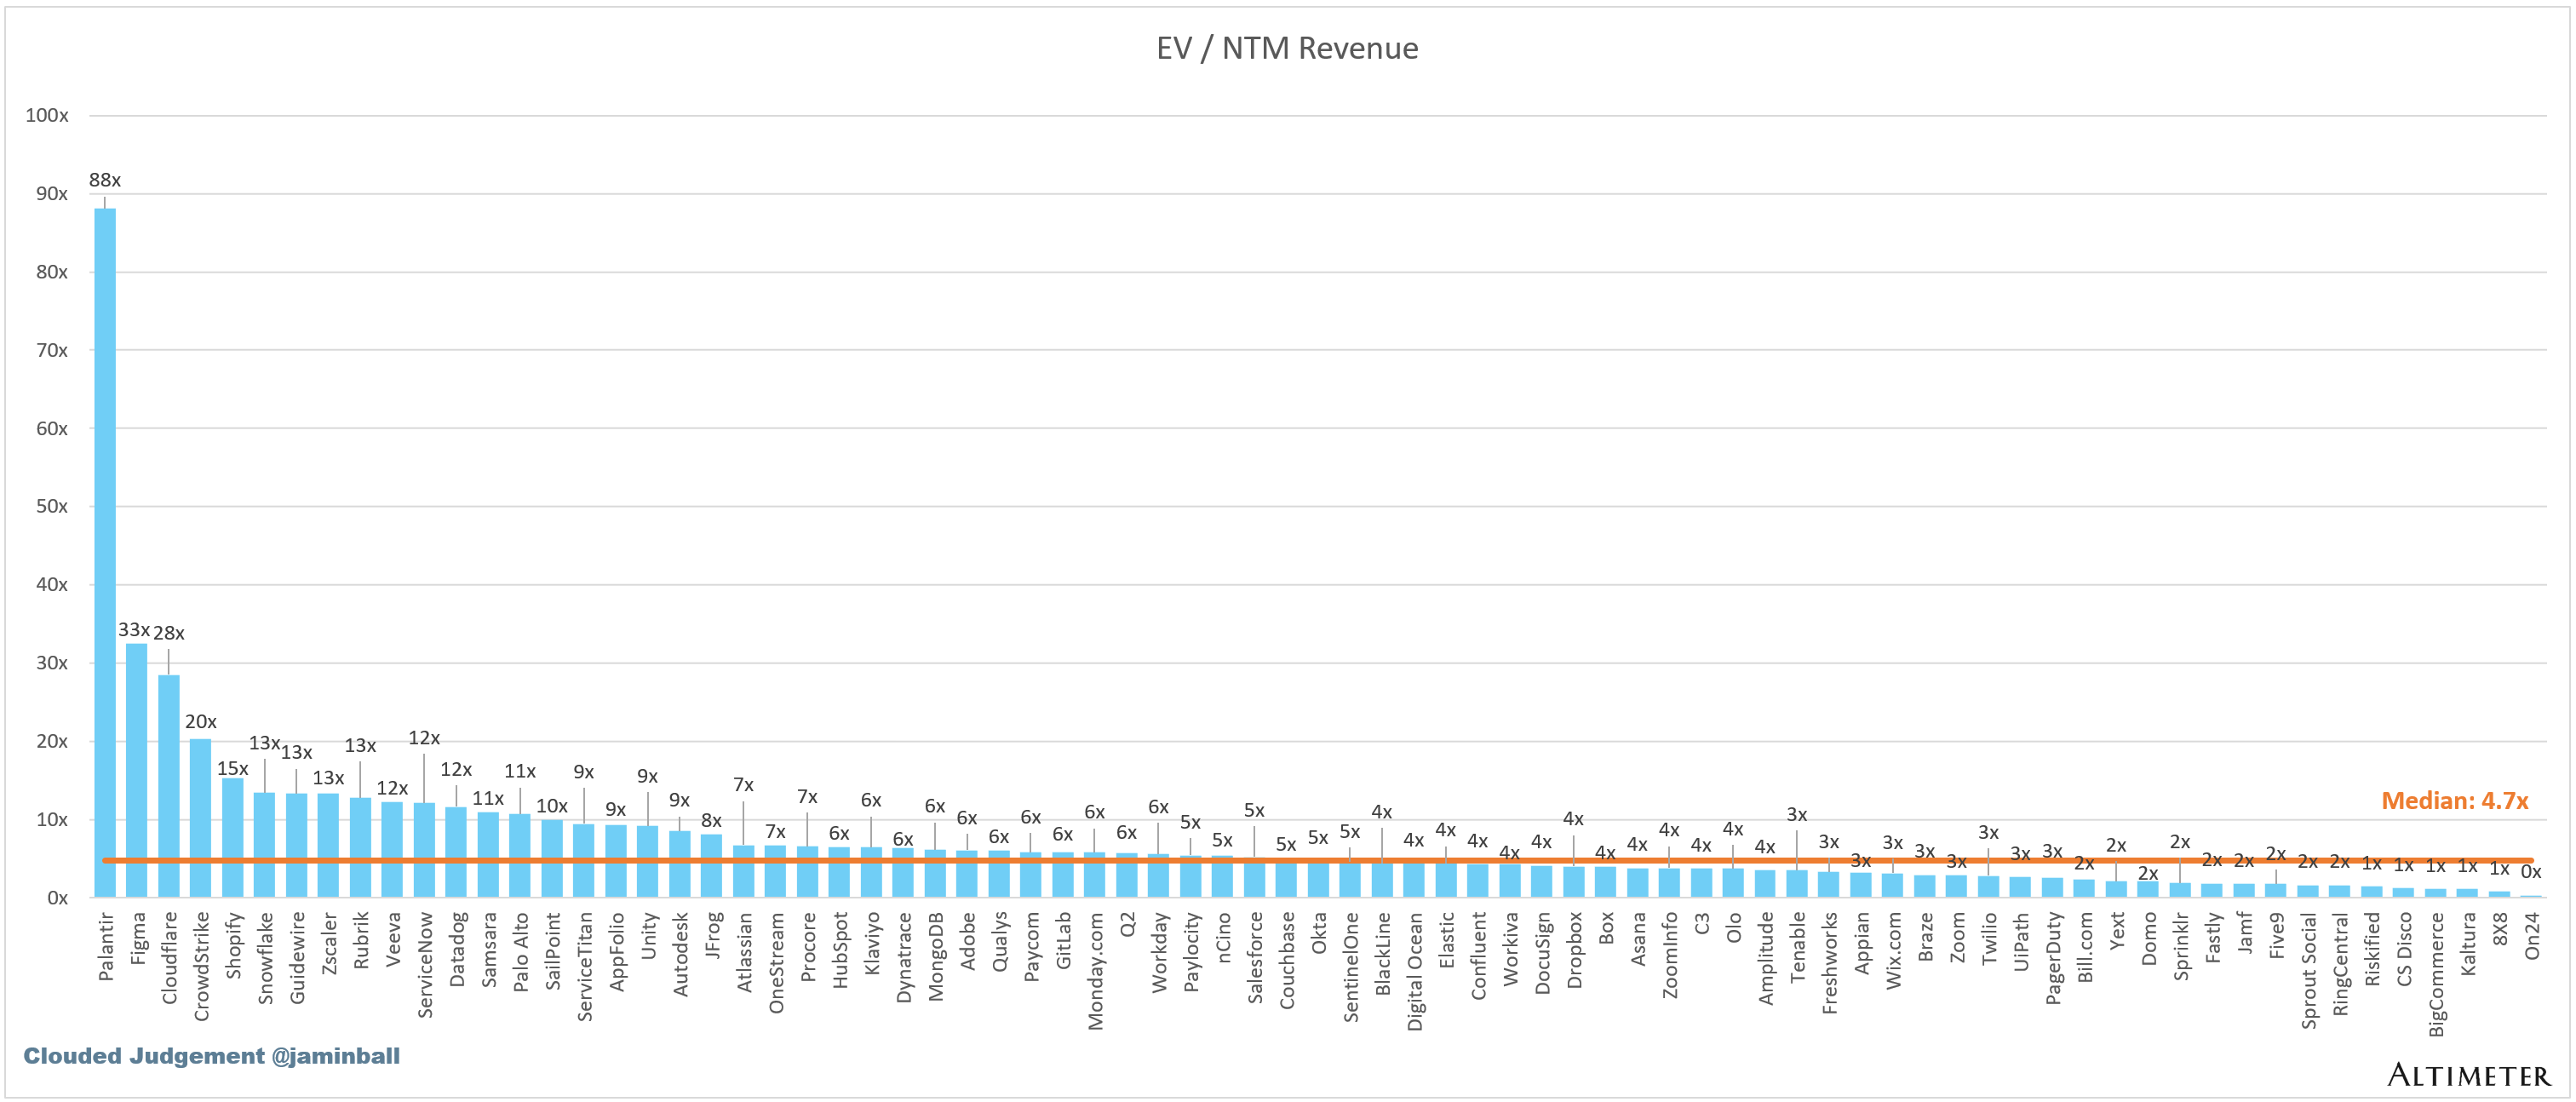
SaaS businesses are generally valued on a multiple of their revenue - in most cases the projected revenue for the next 12 months. Revenue multiples are a shorthand valuation framework. Given most software companies are not profitable, or not generating meaningful FCF, it’s the only metric to compare the entire industry against. Even a DCF is riddled with long term assumptions. The promise of SaaS is that growth in the early years leads to profits in the mature years. Multiples shown below are calculated by taking the Enterprise Value (market cap + debt - cash) / NTM revenue.
Overall Stats:
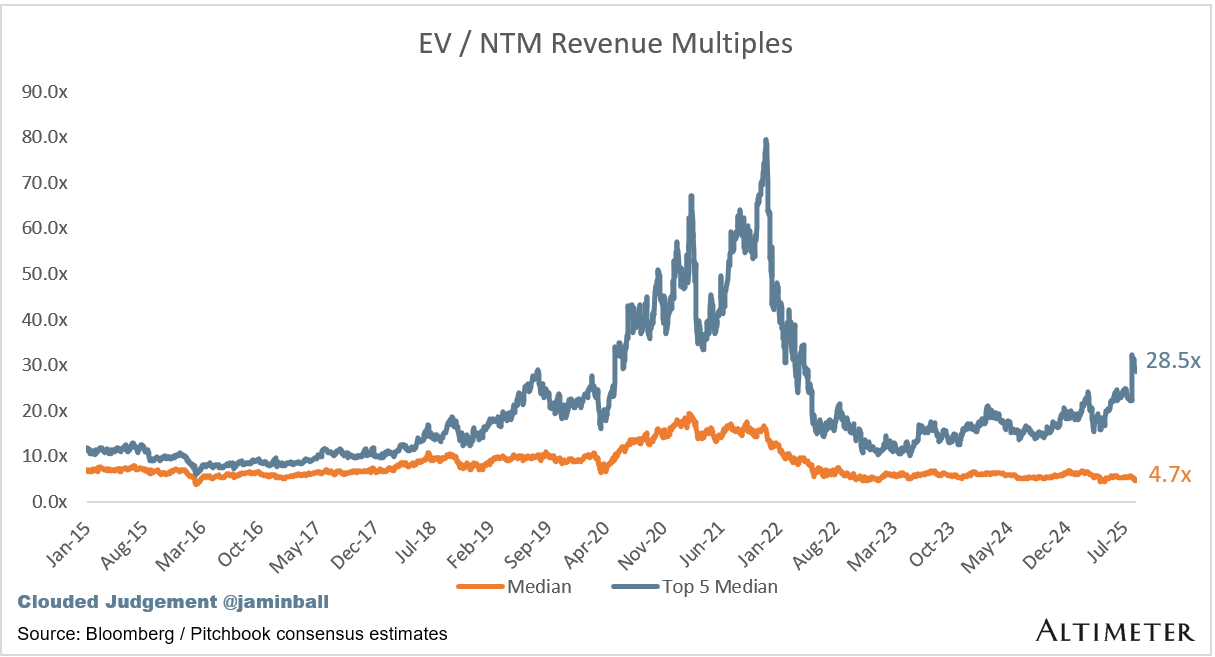
Overall Median: 4.7x
Top 5 Median: 28.5x
10Y: 4.3%
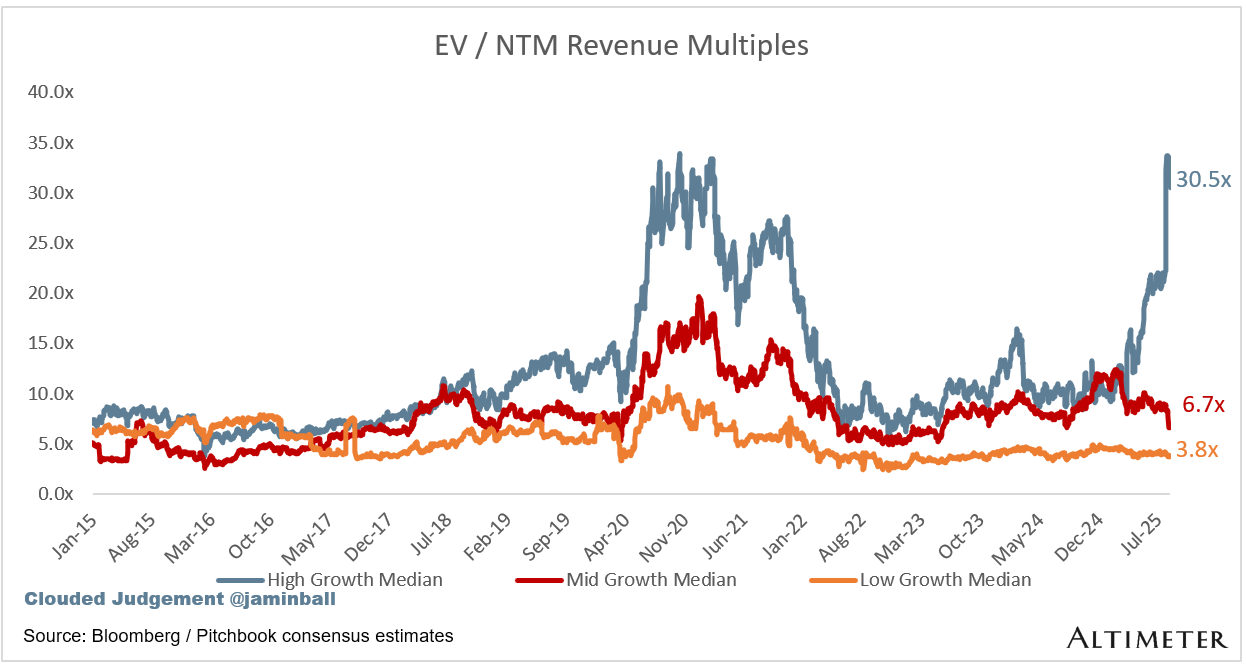
Bucketed by Growth. In the buckets below I consider high growth >25% projected NTM growth, mid growth 15%-25% and low growth <15%
High Growth Median: 30.5x
Mid Growth Median: 6.7x
Low Growth Median: 3.8x
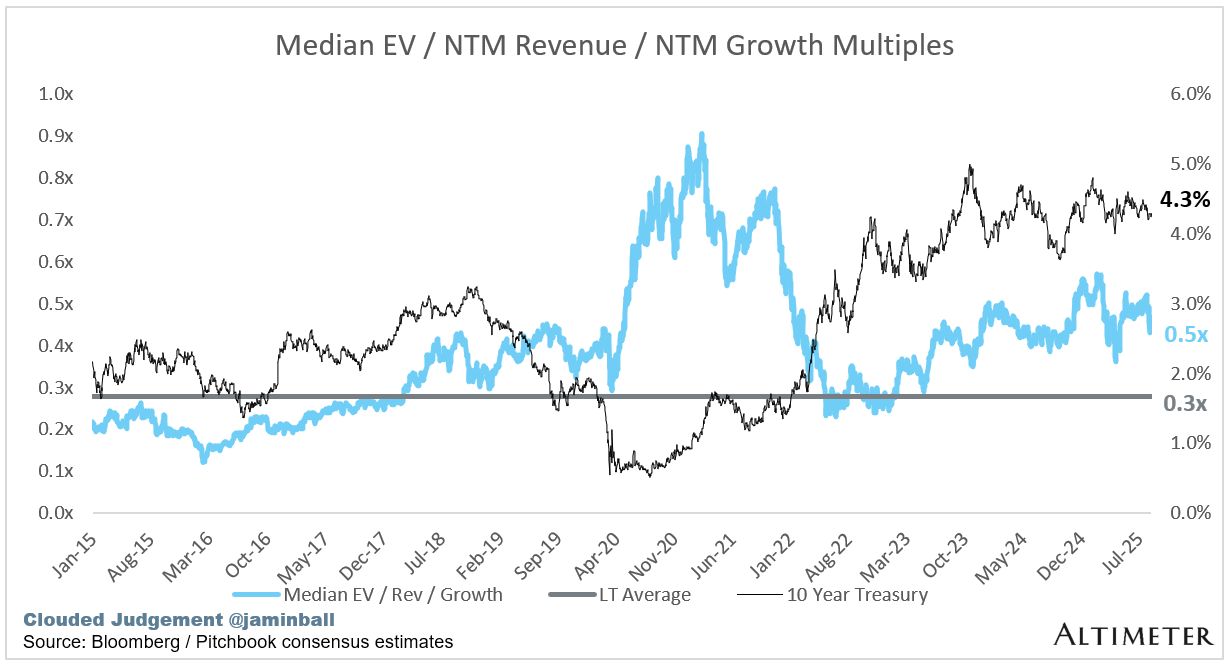
EV / NTM Rev / NTM Growth
The below chart shows the EV / NTM revenue multiple divided by NTM consensus growth expectations. So a company trading at 20x NTM revenue that is projected to grow 100% would be trading at 0.2x. The goal of this graph is to show how relatively cheap / expensive each stock is relative to its growth expectations.
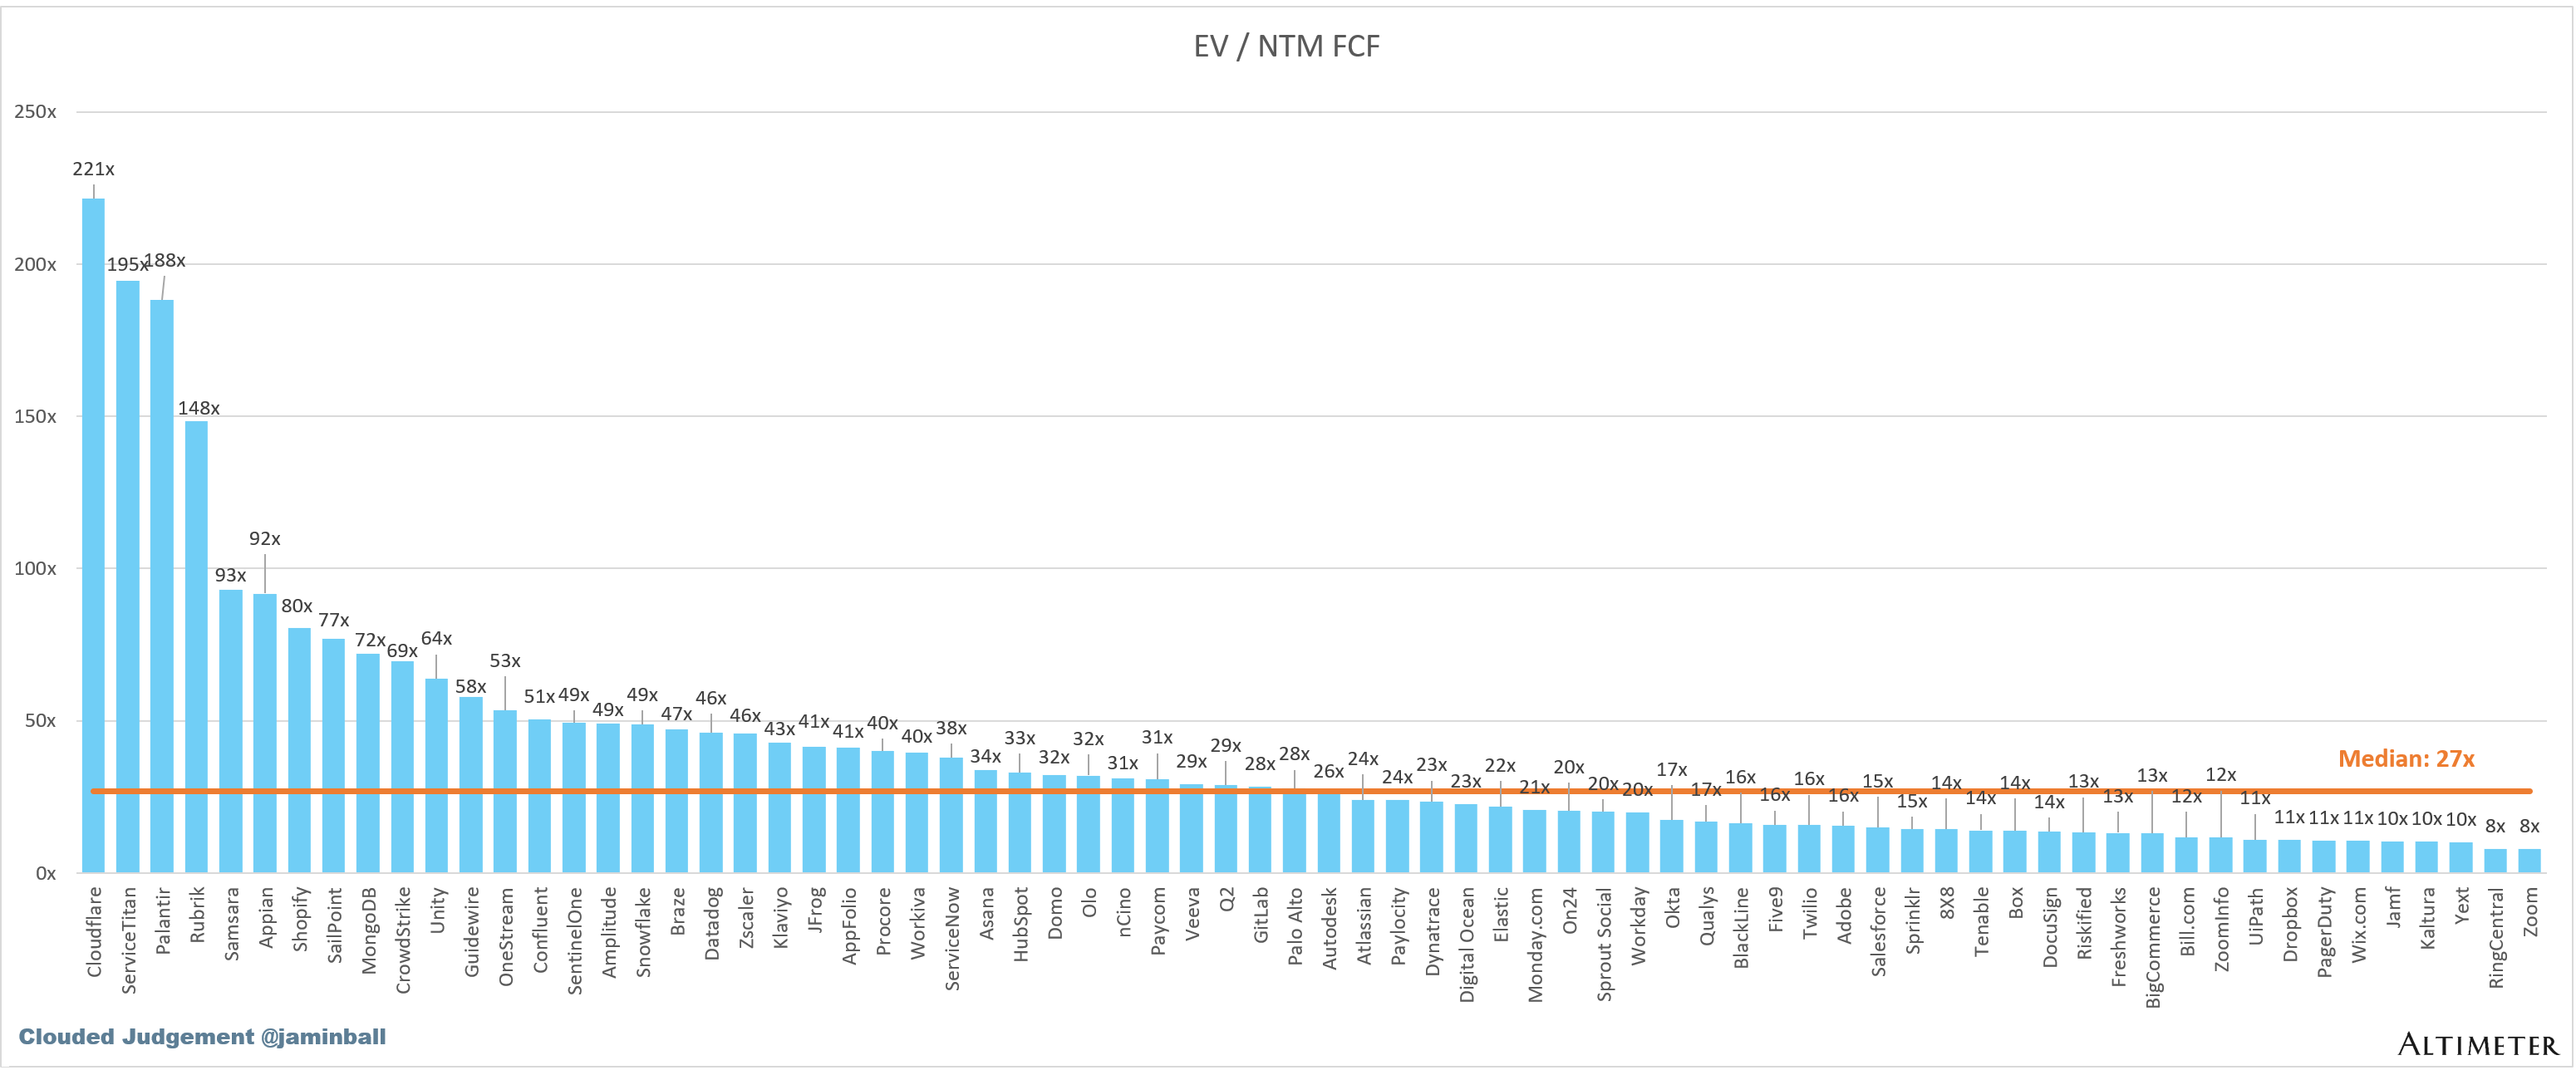
EV / NTM FCF
The line chart shows the median of all companies with a FCF multiple >0x and <100x. I created this subset to show companies where FCF is a relevant valuation metric.
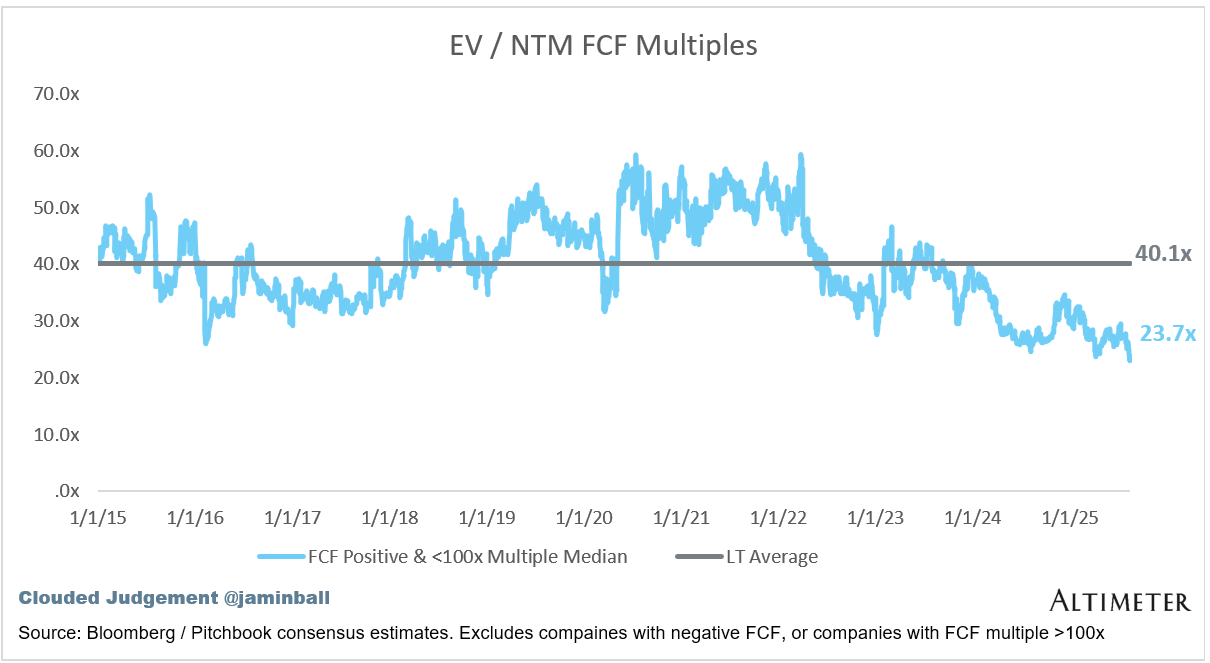
Companies with negative NTM FCF are not listed on the chart
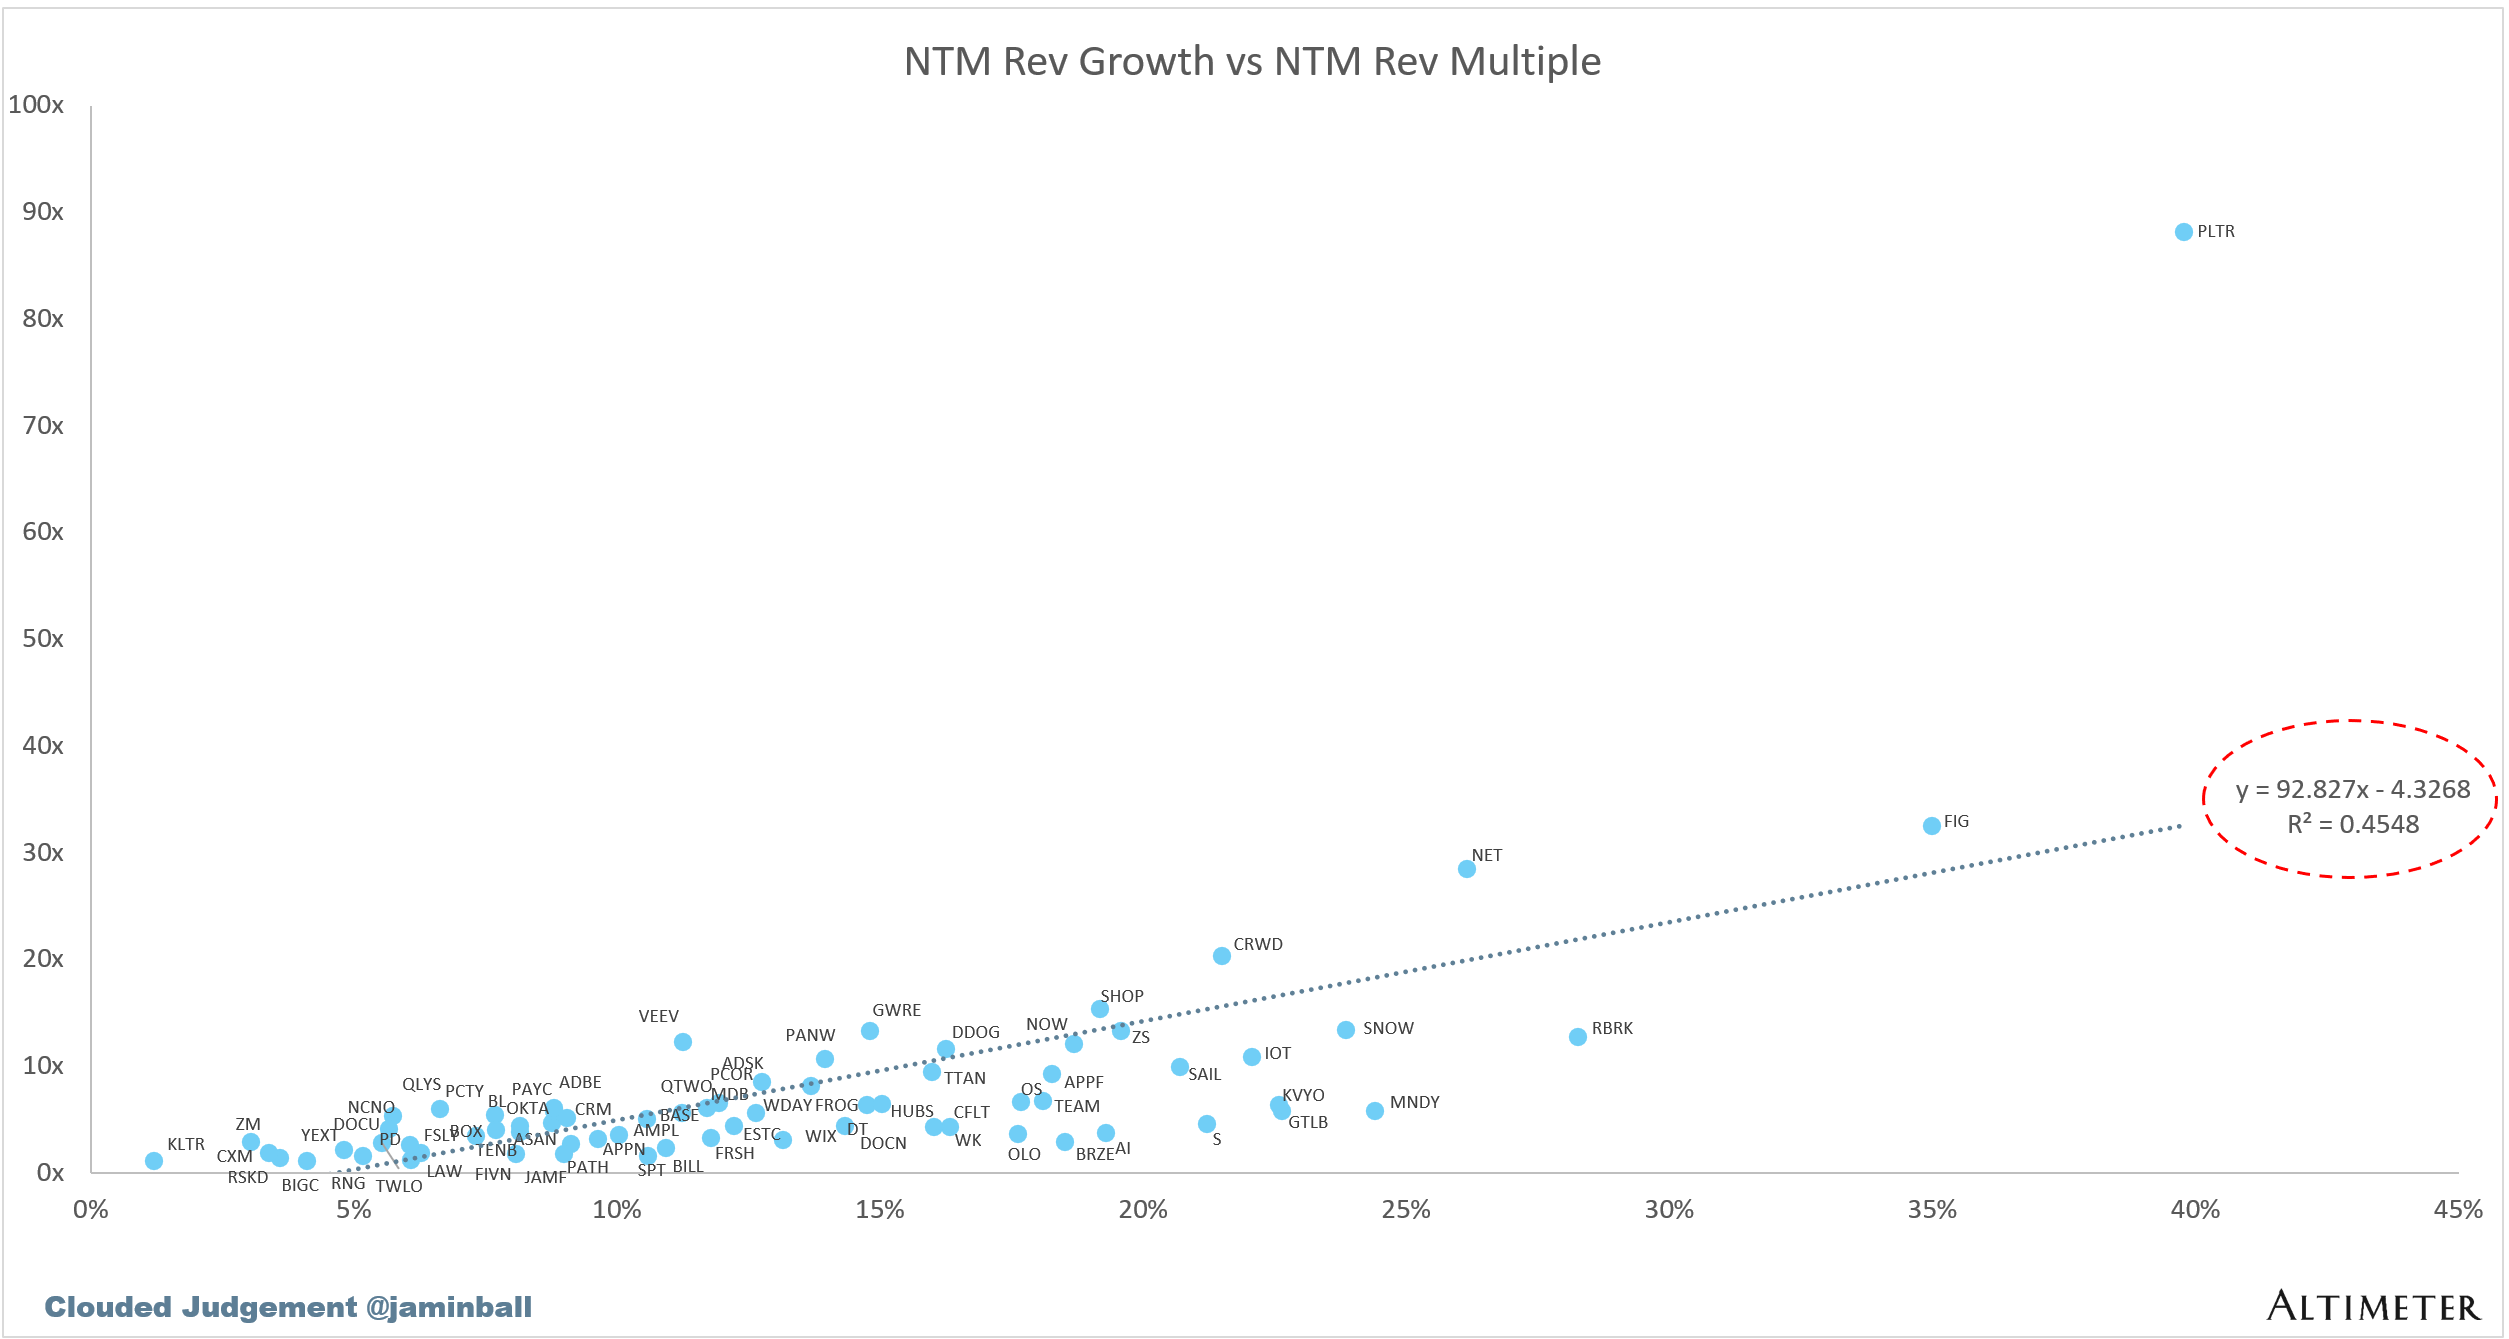
Scatter Plot of EV / NTM Rev Multiple vs NTM Rev Growth
How correlated is growth to valuation multiple?
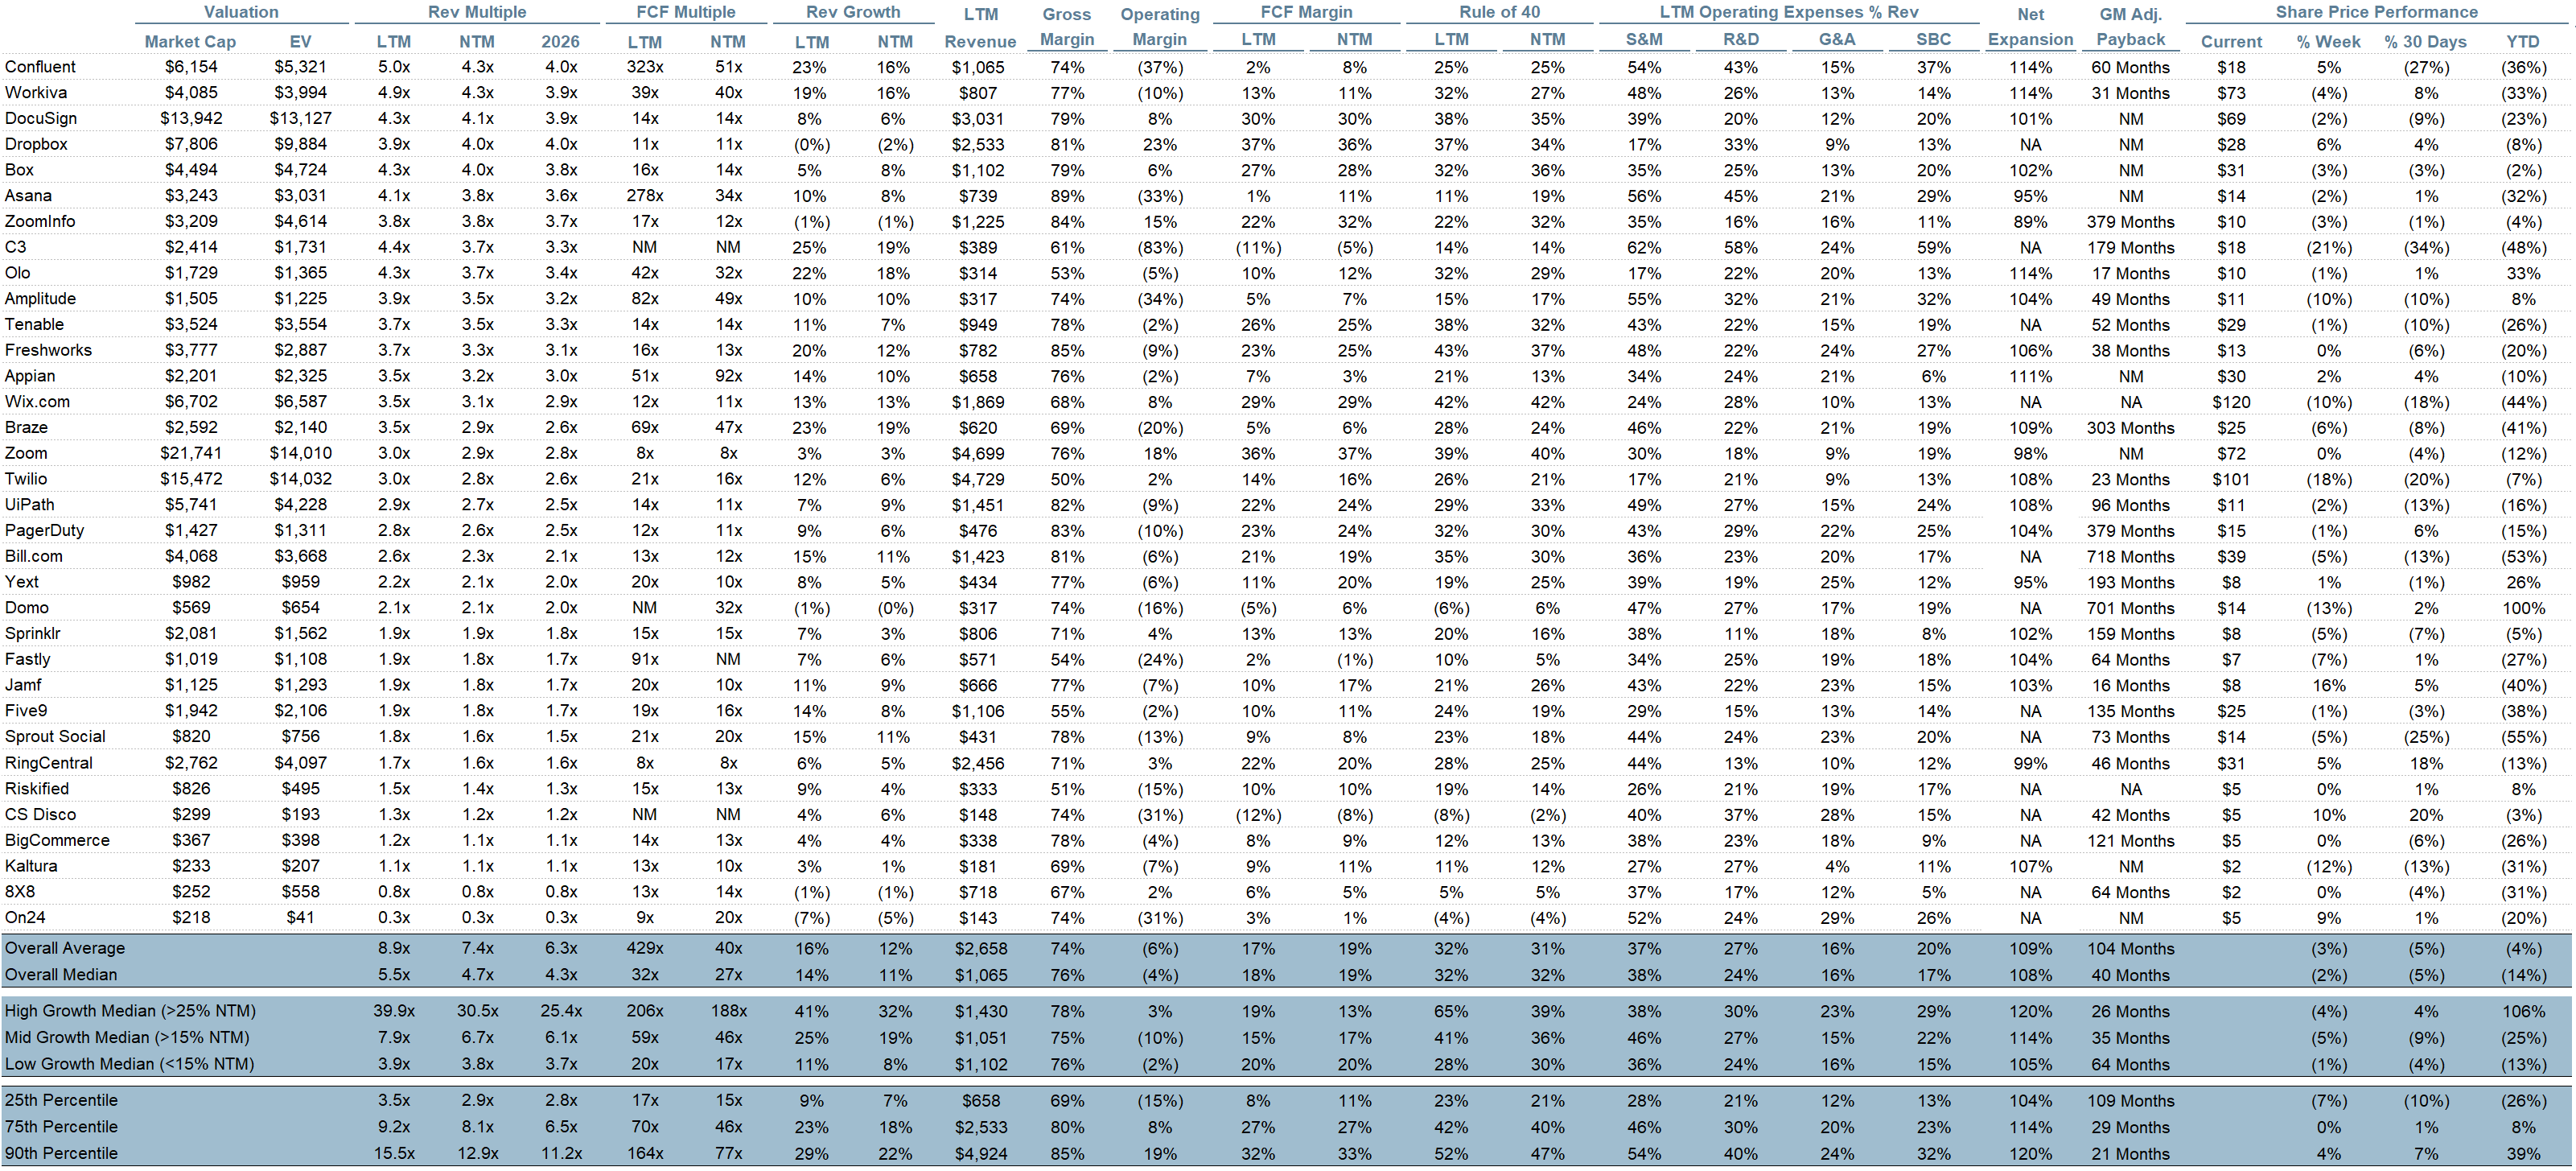
Operating Metrics
Median NTM growth rate: 11%
Median LTM growth rate: 14%
Median Gross Margin: 76%
Median Operating Margin (4%)
Median FCF Margin: 18%
Median Net Retention: 108%
Median CAC Payback: 40 months
Median S&M % Revenue: 38%
Median R&D % Revenue: 24%
Median G&A % Revenue: 16%
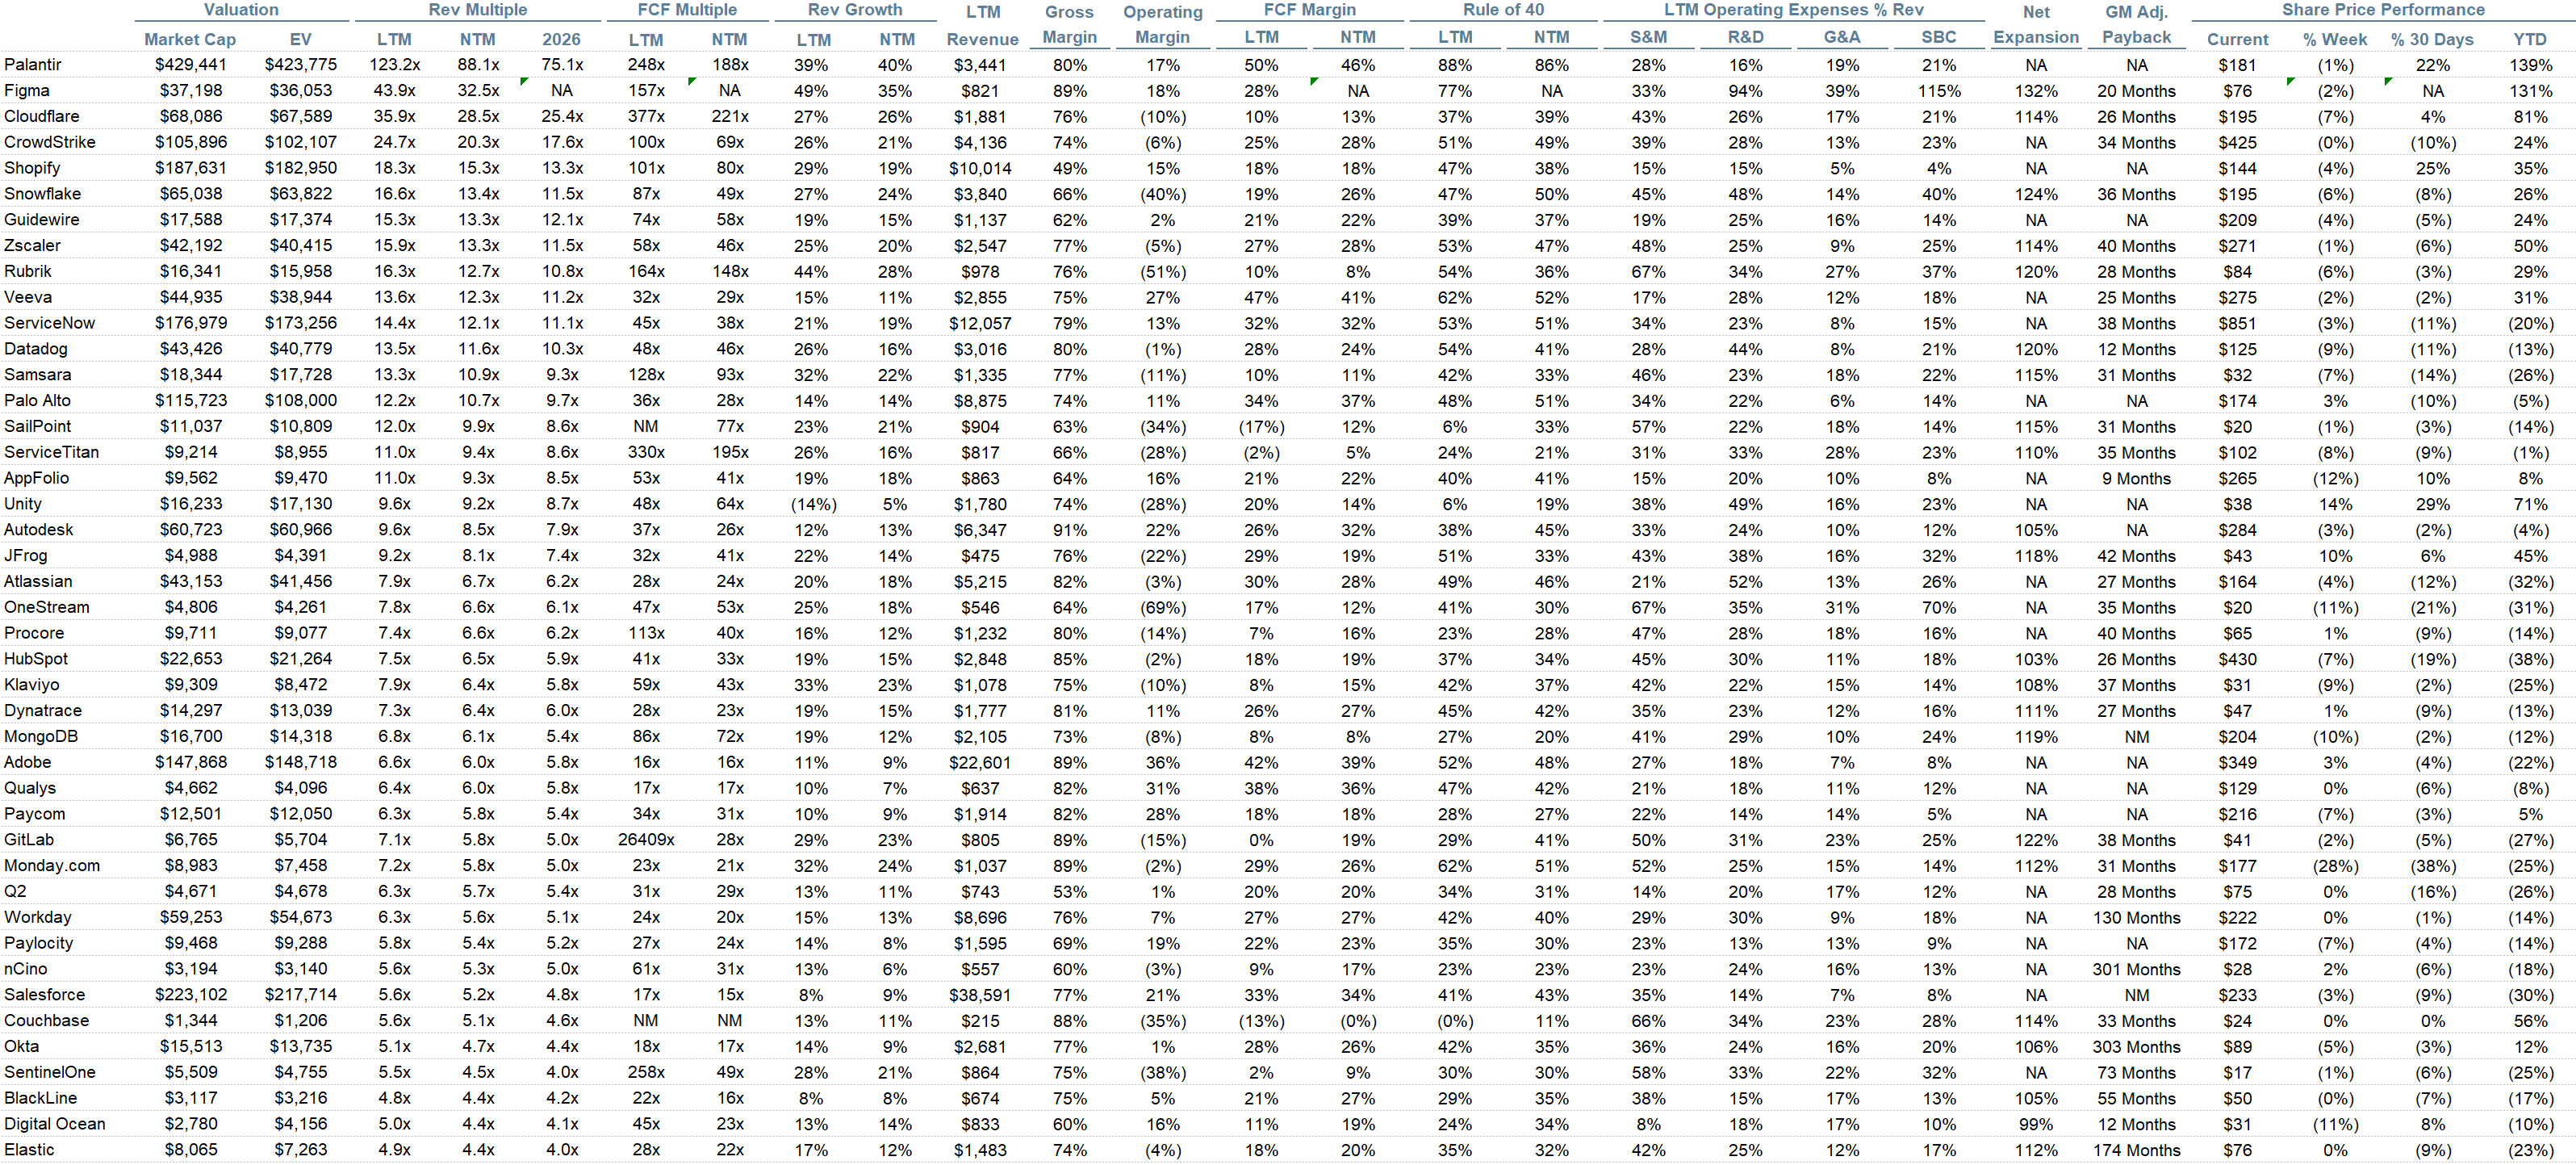
Comps Output
Rule of 40 shows rev growth + FCF margin (both LTM and NTM for growth + margins). FCF calculated as Cash Flow from Operations - Capital Expenditures
GM Adjusted Payback is calculated as: (Previous Q S&M) / (Net New ARR in Q x Gross Margin) x 12. It shows the number of months it takes for a SaaS business to pay back its fully burdened CAC on a gross profit basis. Most public companies don’t report net new ARR, so I’m taking an implied ARR metric (quarterly subscription revenue x 4). Net new ARR is simply the ARR of the current quarter, minus the ARR of the previous quarter. Companies that do not disclose subscription rev have been left out of the analysis and are listed as NA.
Sources used in this post include Bloomberg, Pitchbook and company filings
The information presented in this newsletter is the opinion of the author and does not necessarily reflect the view of any other person or entity, including Altimeter Capital Management, LP ("Altimeter"). The information provided is believed to be from reliable sources but no liability is accepted for any inaccuracies. This is for information purposes and should not be construed as an investment recommendation. Past performance is no guarantee of future performance. Altimeter is an investment adviser registered with the U.S. Securities and Exchange Commission. Registration does not imply a certain level of skill or training. Altimeter and its clients trade in public securities and have made and/or may make investments in or investment decisions relating to the companies referenced herein. The views expressed herein are those of the author and not of Altimeter or its clients, which reserve the right to make investment decisions or engage in trading activity that would be (or could be construed as) consistent and/or inconsistent with the views expressed herein.
This post and the information presented are intended for informational purposes only. The views expressed herein are the author’s alone and do not constitute an offer to sell, or a recommendation to purchase, or a solicitation of an offer to buy, any security, nor a recommendation for any investment product or service. While certain information contained herein has been obtained from sources believed to be reliable, neither the author nor any of his employers or their affiliates have independently verified this information, and its accuracy and completeness cannot be guaranteed. Accordingly, no representation or warranty, express or implied, is made as to, and no reliance should be placed on, the fairness, accuracy, timeliness or completeness of this information. The author and all employers and their affiliated persons assume no liability for this information and no obligation to update the information or analysis contained herein in the future.
Wow, Palantir absolutely breaking away from the pack and in a stratosphere of its own as shown in the scatter plot
Great breakdown.....makes a strong case that software isn’t going anywhere, but adaptation with AI is key for long-term relevance.