

Every week I’ll provide updates on the latest trends in cloud software companies. Follow along to stay up to date!
What Could Go Right?
Whenever I’m thinking about making a private investment there’s (broadly) a couple main questions I ask myself:
What could go right
If things go right how big can it get
What could go wrong
The reality is the first two are kind of the same question, and the third question is completely irrelevant (in my opinion). I bring this up because so often the conversation around venture stage company investing is about the risks. Execution risk. Market risk. Competitive risk. Hiring risk. etc. What if the market isn’t big enough? What if they can’t execute on this vision? The deck is massively stacked against startups. The reality is only a miniscule fraction ever actually turn into big companies! And all the reasons to be hesitant are right! In a vacuum, the reasons to not invest in a startup almost always overwhelm the reasons to invest. And given the failure rate, the “bears” are usually right!
However - venture is a power law business. It’s a statement that’s so incredibly simple, and so incredibly viewed as “obvious,” yet at the same time it feels like most folk don’t actually invest or build a portfolio with this simple truth in mind (and I find myself drifting from it from time to time!).
If it goes right, how big could it get? That’s really the question to ask right now. The reason question three doesn’t really matter (in my opinion) is because of asymmetry. Being wrong comes with a 1x your money loss max downside. Being right comes with uncapped upside. An interesting sidenote here - a very large institutional LP shared some data on the distribution of outcomes in funds for top quartiles and bottom quartiles. Interestingly both the top quartile and bottom quartile funds had the same percentage of investments that returned <1x in a fund. 50%. I call this out to say - the percentage of deals you loose money on has no impact on top quartile vs bottom quartile funds.
The question of “how big could it get” also comes with extra weight currently. For the last ~15 years, the theoretical TAM ceiling on any software company was some flavor of software budgets. With many of the AI companies today, the TAM ceiling is no longer software budgets (but headcount / consulting budgets). Again, this is nothing revolutionary. But I’m constantly reminded of examples of this. And this concept of TAM ceilings rising with new technology leaps is nothing new. It’s one of the reasons the top decile outcomes keep growing and growing in size. When I got into venture, a $1b public company was considered an amazing outcome. Not anymore…BUT - oftentimes investing at the time it was hard to think of the top outcomes being much more than that, given this was the “ceiling” at the time (not an actual ceiling, but the general range of the top bucket of outcomes). Imagine passing on Snowflake in 2017 because “Teradata market cap is only $4b.” In moments of large tech disruption, the size of the prize grows rapidly!
It’s what can make investing today (and assuming today’s exit valuations will be tomorrow’s exit valuations) tricky. I’m certain the top decile outcomes in 2036 will be meaningfully higher than what they are today - but really investing with this frame of mind is hard. This isn’t to say every company will be a great company and it’s easy to invest right now. Quite the opposite. There’s more companies than ever getting started today (which makes being a VC extra fun). But the unfortunate truth remains, most won’t work out. The only thing that matters is finding the founders who can do the impossible! If things go right, how big could it get?
Quarterly Reports Summary

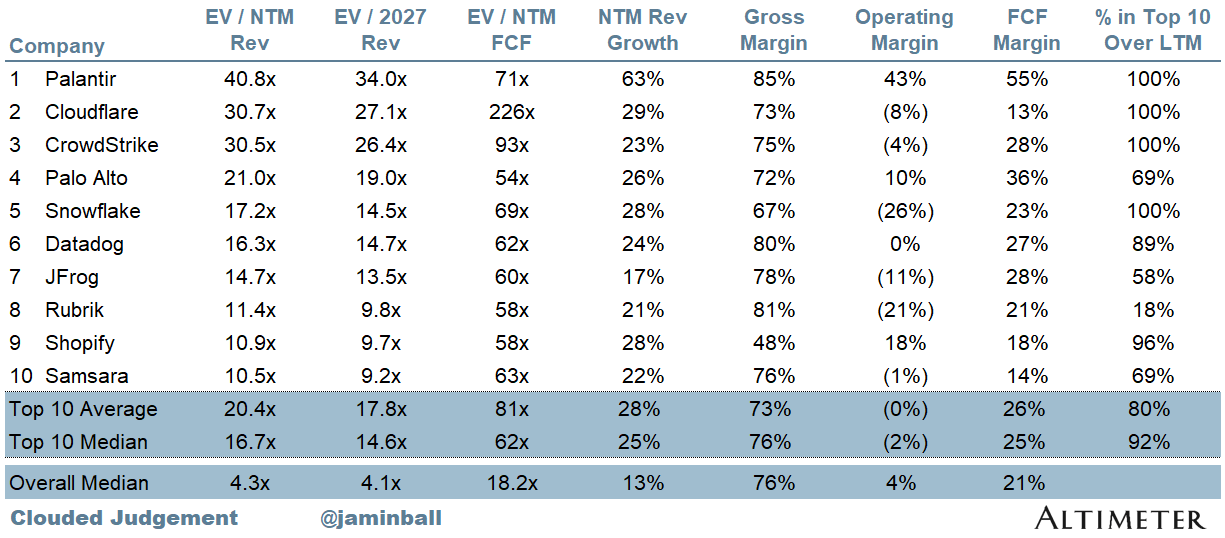
Top 10 EV / NTM Revenue Multiples
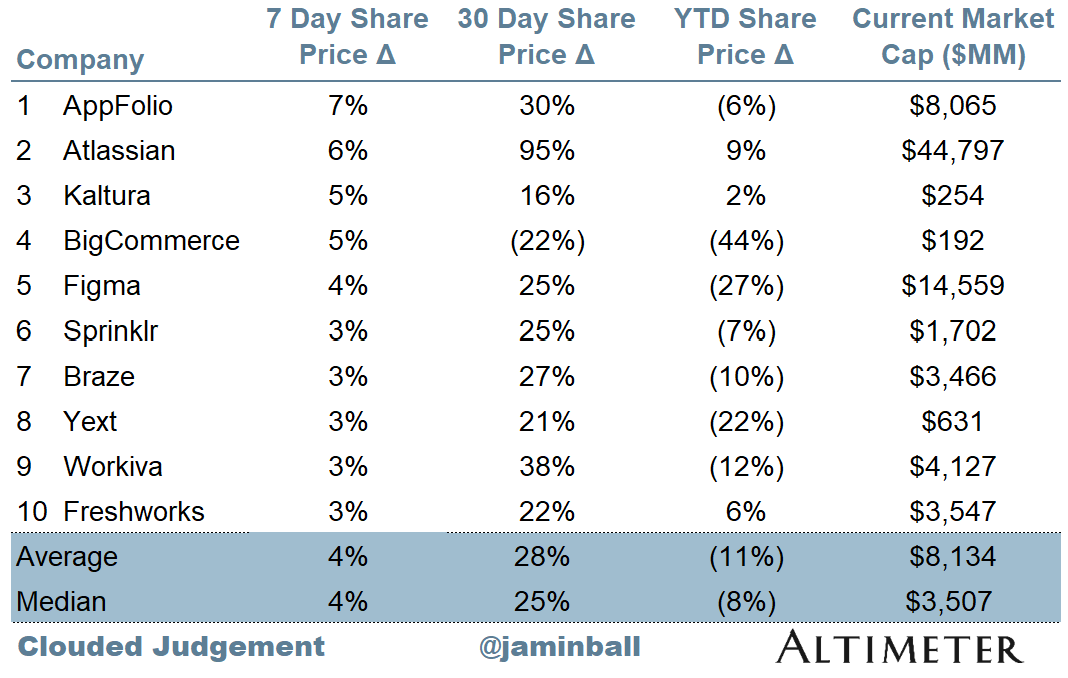
Top 10 Weekly Share Price Movement
Update on Multiples
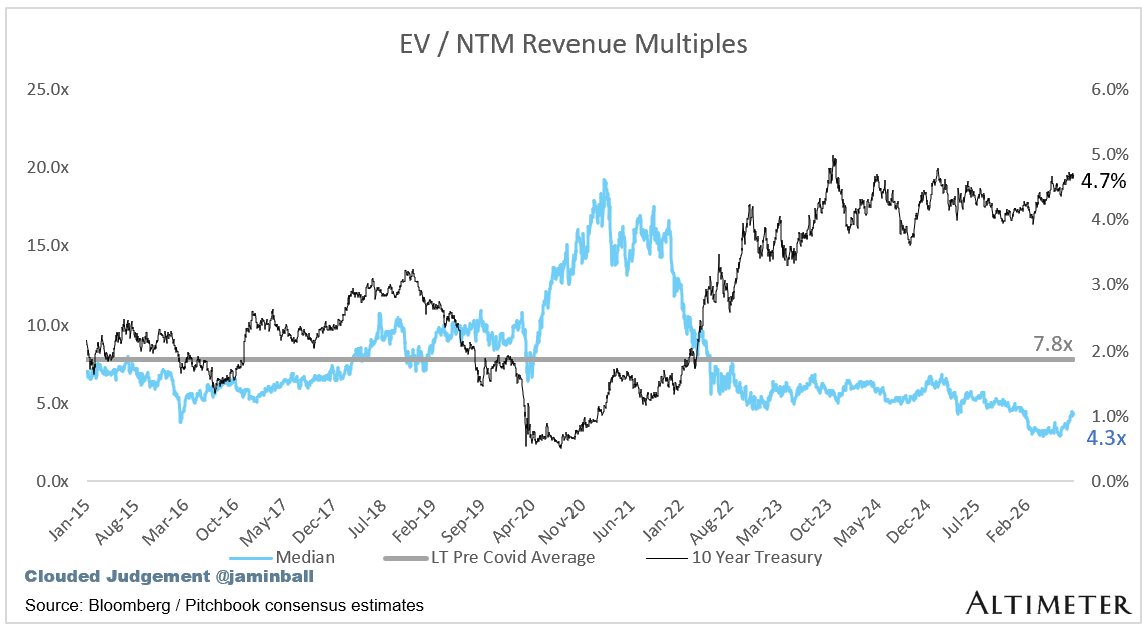
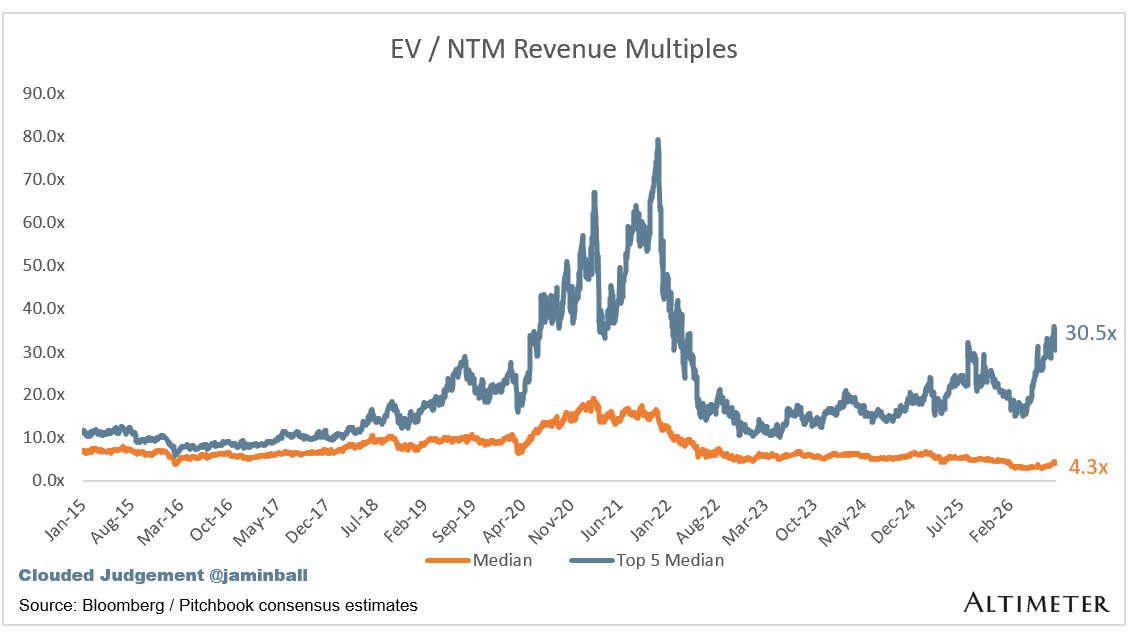
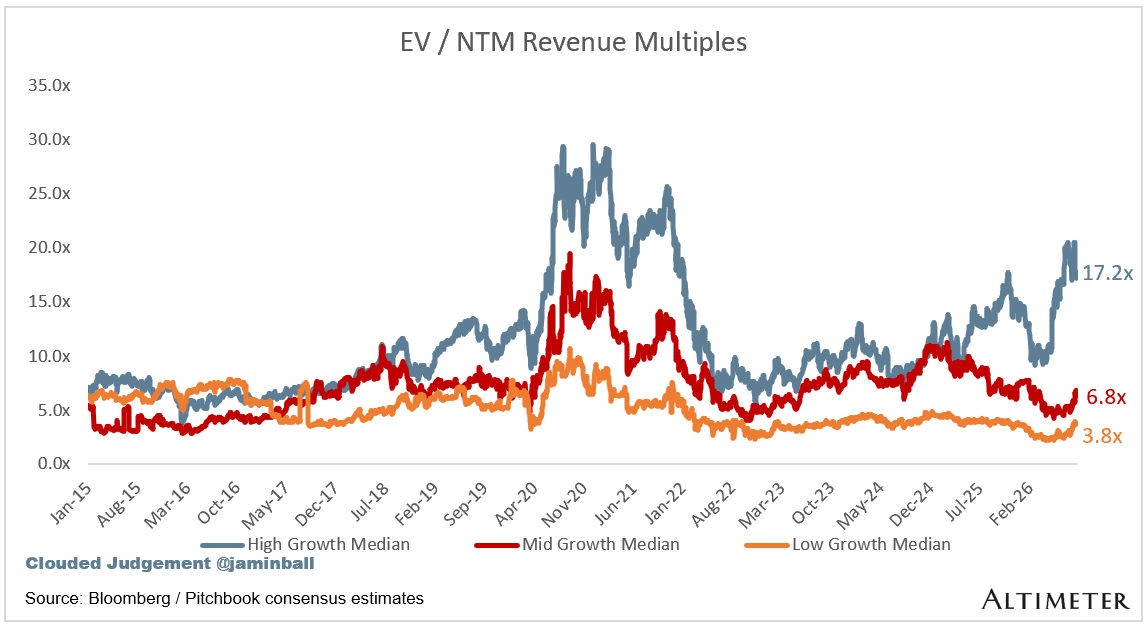
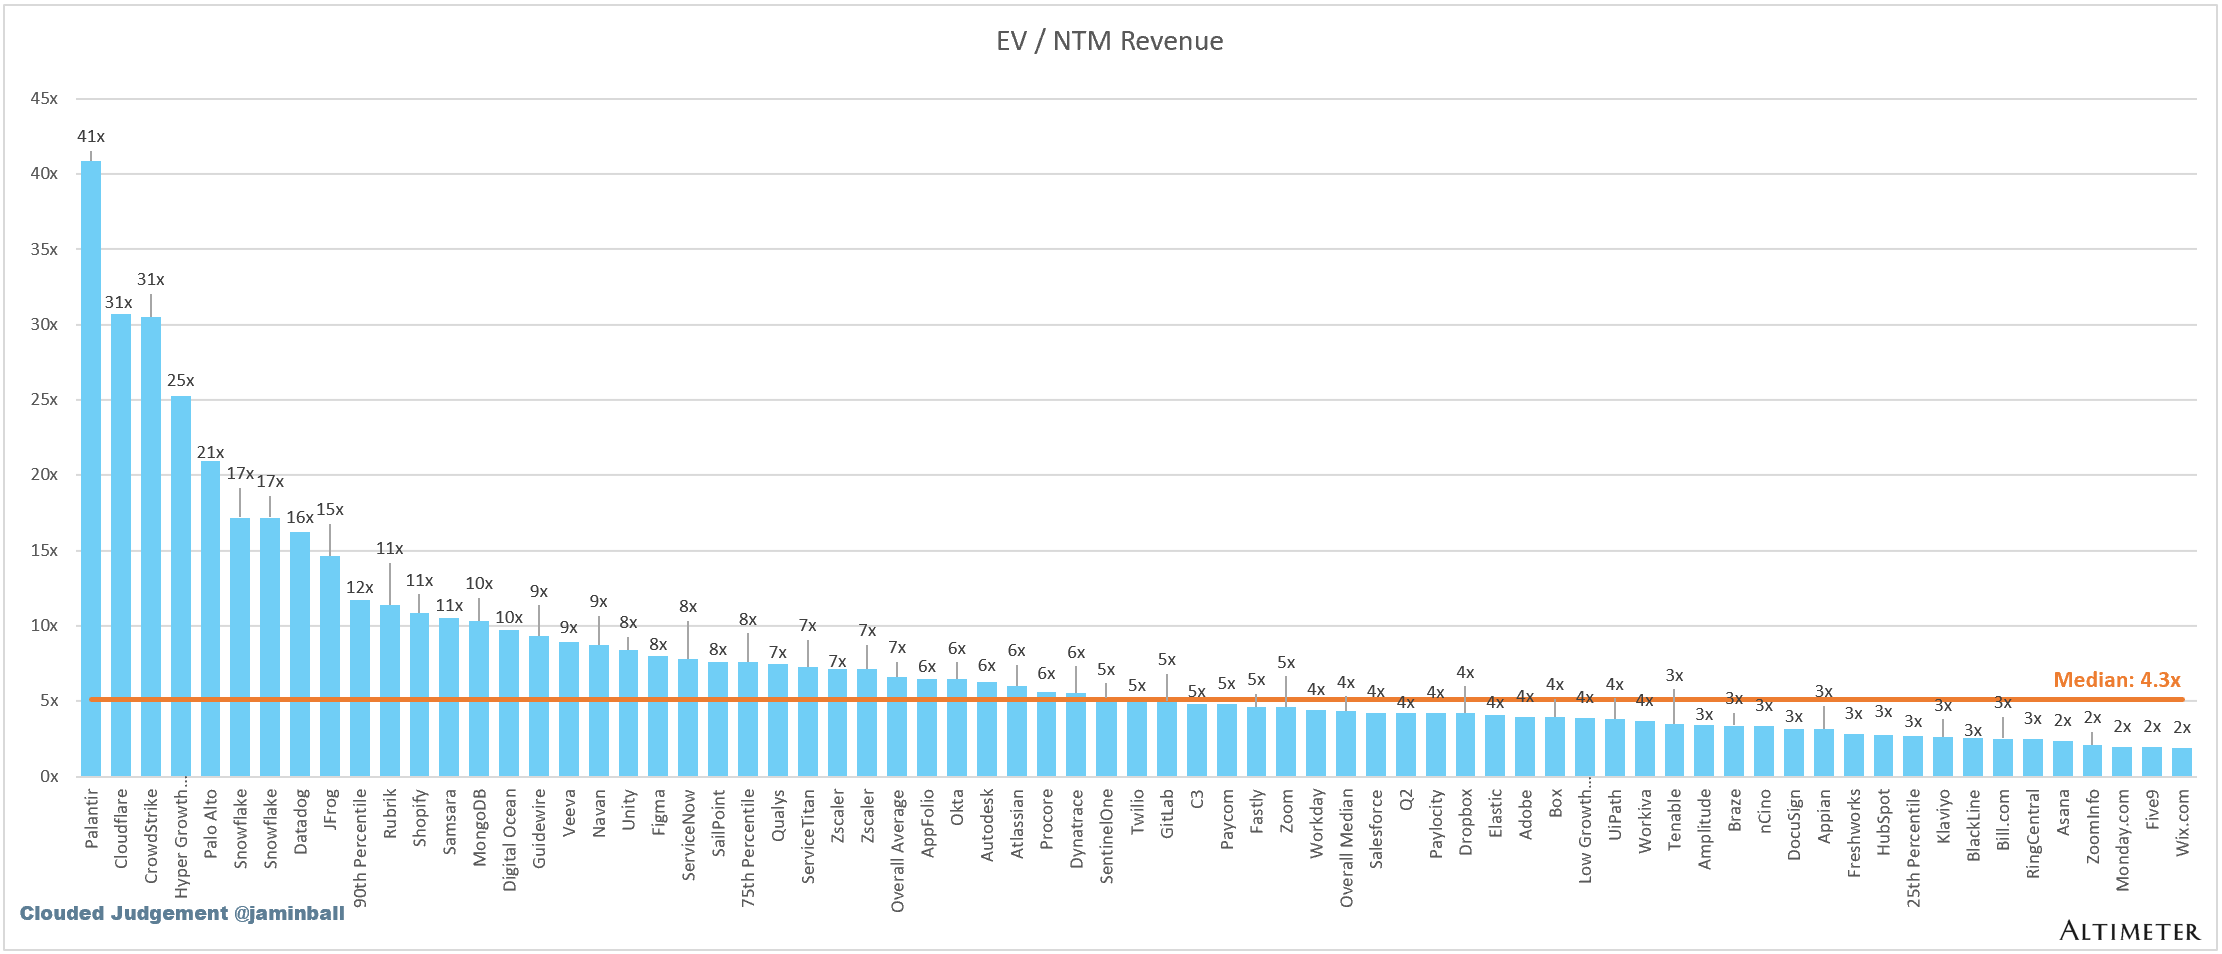
SaaS businesses are generally valued on a multiple of their revenue - in most cases the projected revenue for the next 12 months. Revenue multiples are a shorthand valuation framework. Given most software companies are not profitable, or not generating meaningful FCF, it’s the only metric to compare the entire industry against. Even a DCF is riddled with long term assumptions. The promise of SaaS is that growth in the early years leads to profits in the mature years. Multiples shown below are calculated by taking the Enterprise Value (market cap + debt - cash) / NTM revenue.
Overall Stats:
Overall Median: 4.3x
Top 5 Median: 30.5x
10Y: 4.7%
Bucketed by Growth. In the buckets below I consider high growth >22% projected NTM growth, mid growth 15%-22% and low growth <15%. I had to adjusted the cut off for “high growth.” If 22% feels a bit arbitrary, it’s because it is…I just picked a cutoff where there were ~10 companies that fit into the high growth bucket so the sample size was more statistically significant
High Growth Median: 17.2x
Mid Growth Median: 6.8x
Low Growth Median: 3.8x
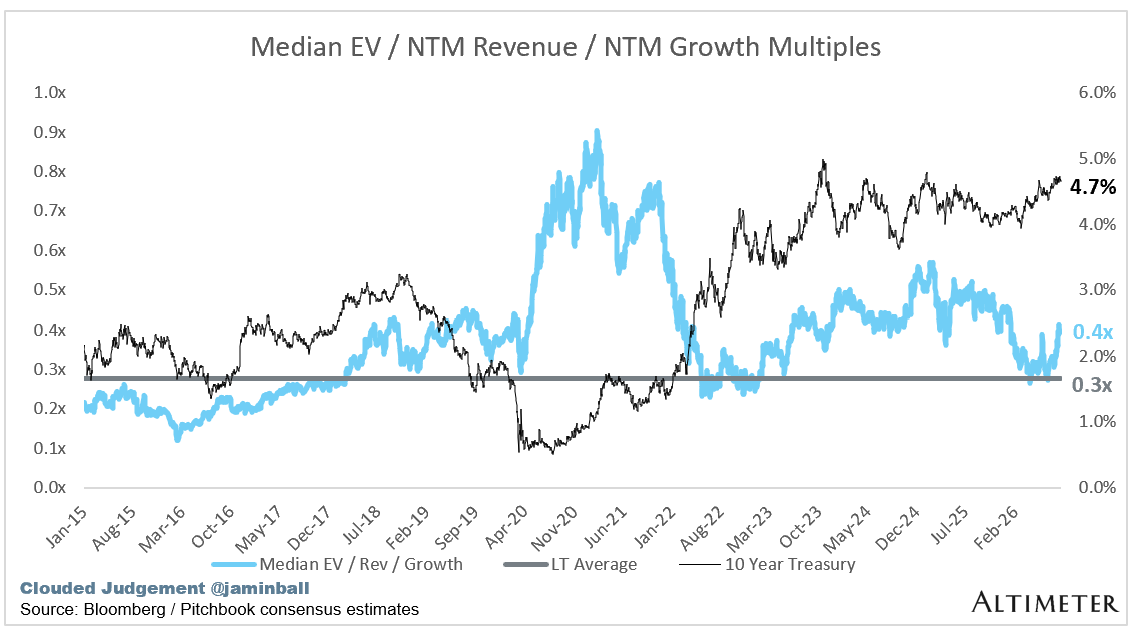
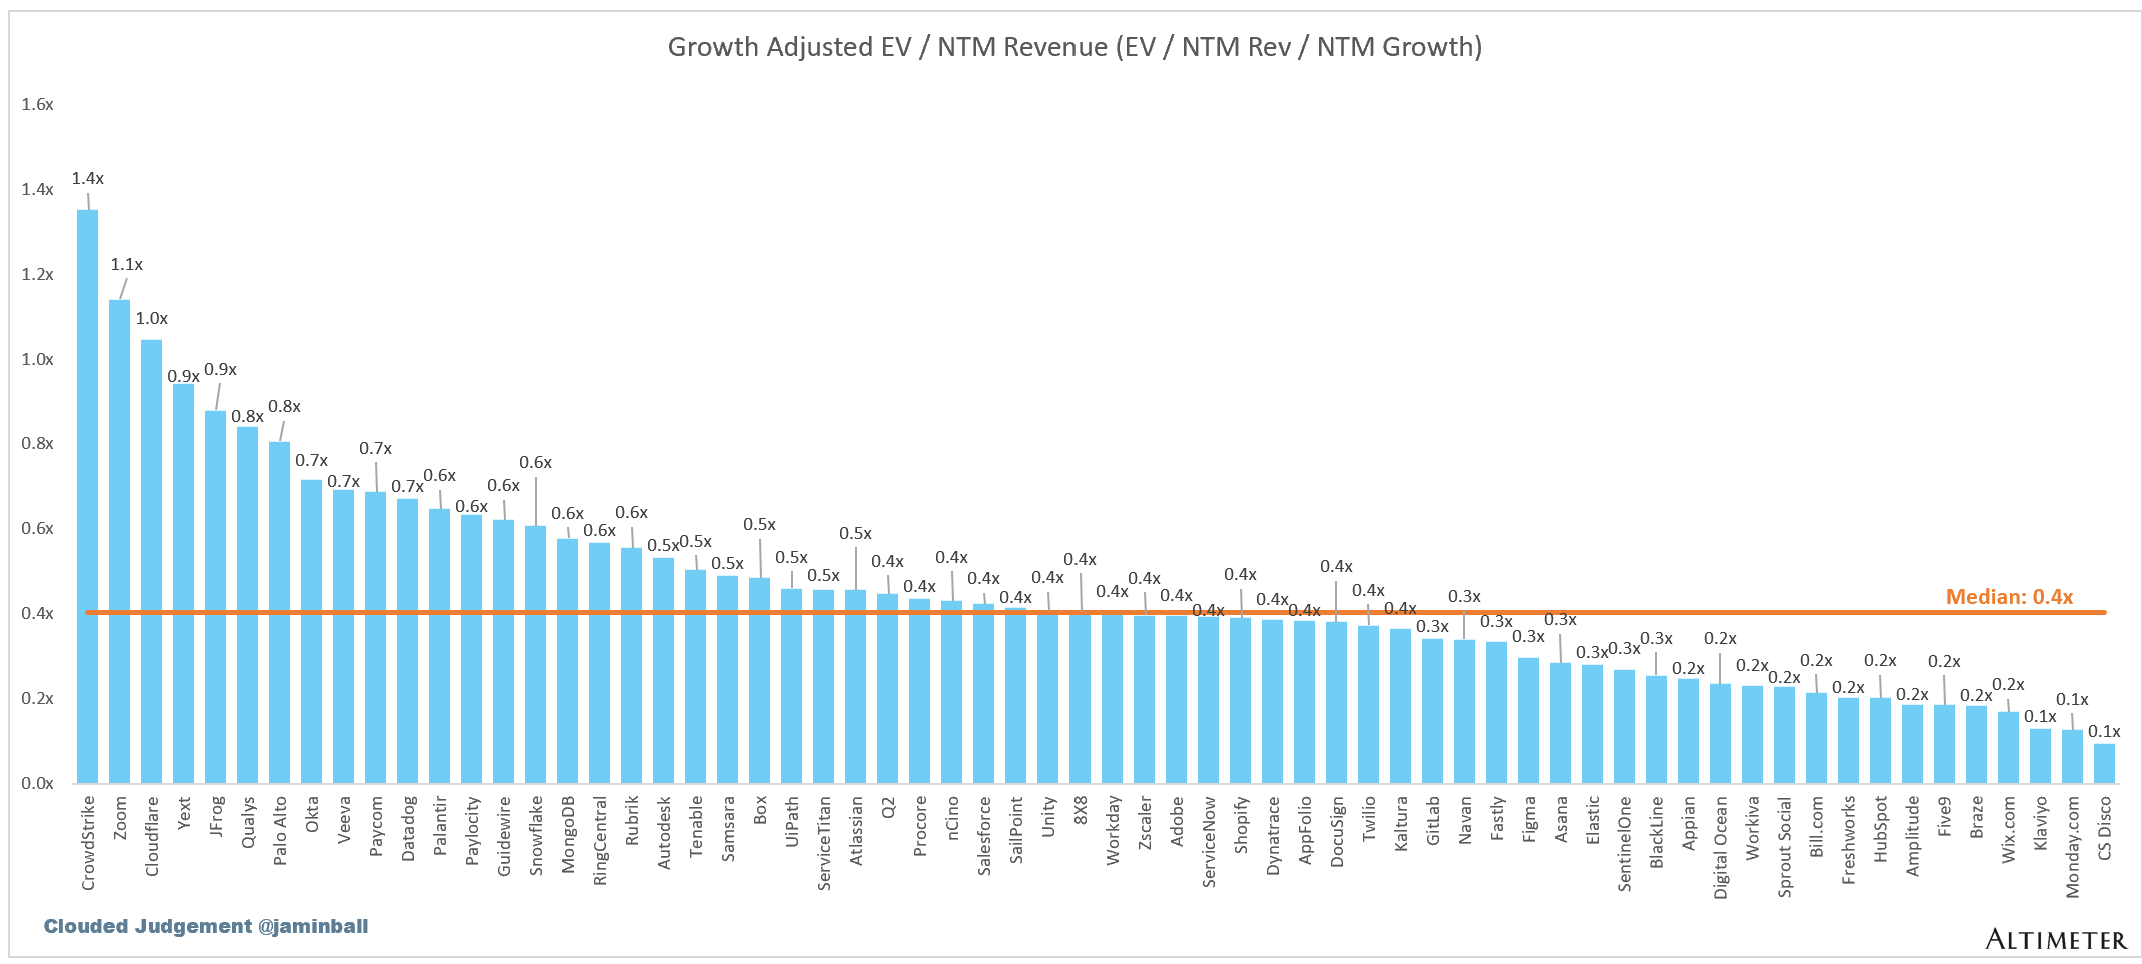
EV / NTM Rev / NTM Growth
The below chart shows the EV / NTM revenue multiple divided by NTM consensus growth expectations. So a company trading at 20x NTM revenue that is projected to grow 100% would be trading at 0.2x. The goal of this graph is to show how relatively cheap / expensive each stock is relative to its growth expectations.
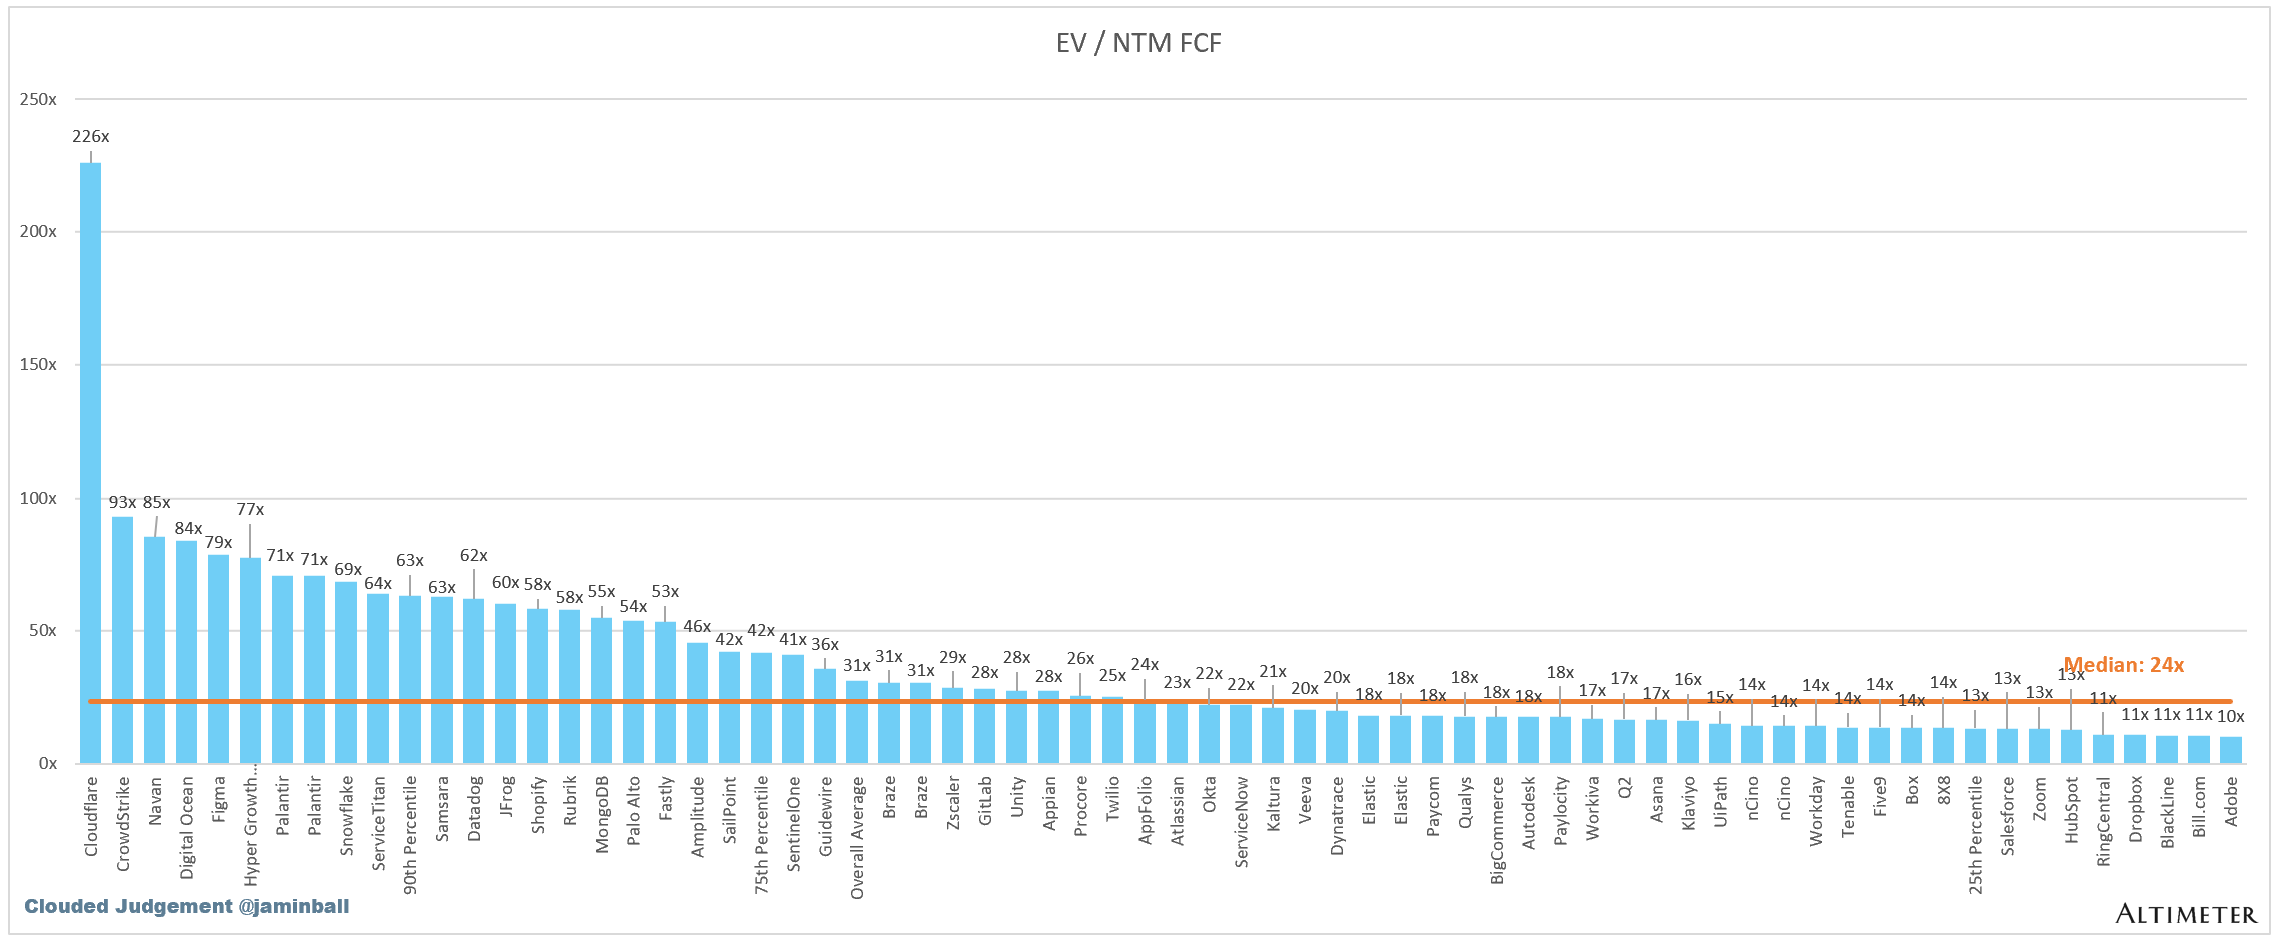
EV / NTM FCF
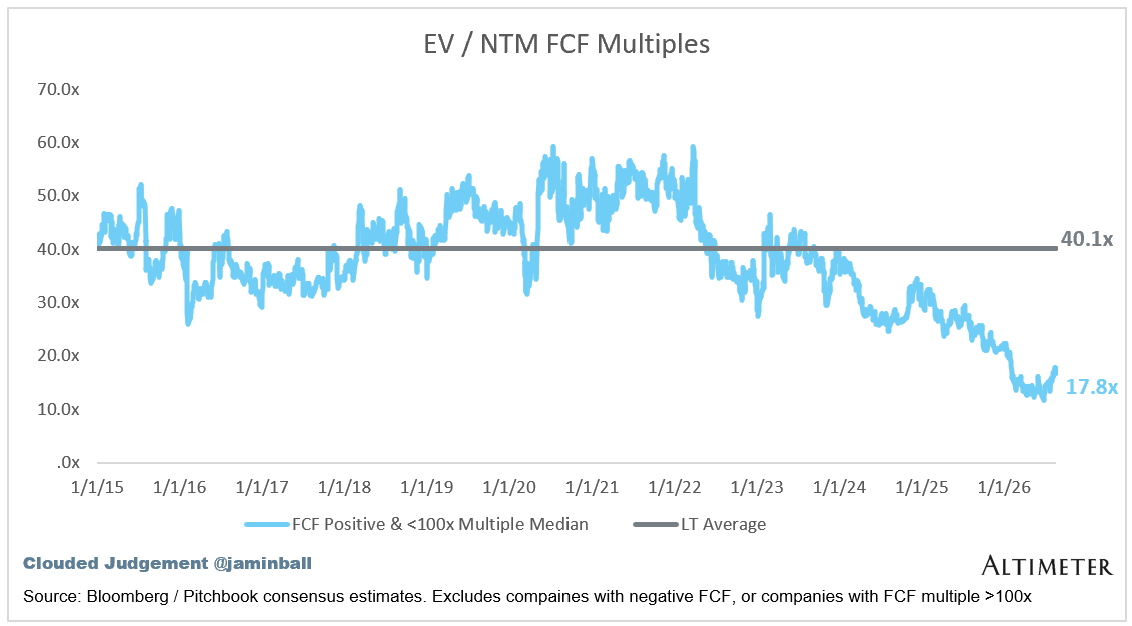
The line chart shows the median of all companies with a FCF multiple >0x and <100x. I created this subset to show companies where FCF is a relevant valuation metric.
Companies with negative NTM FCF are not listed on the chart
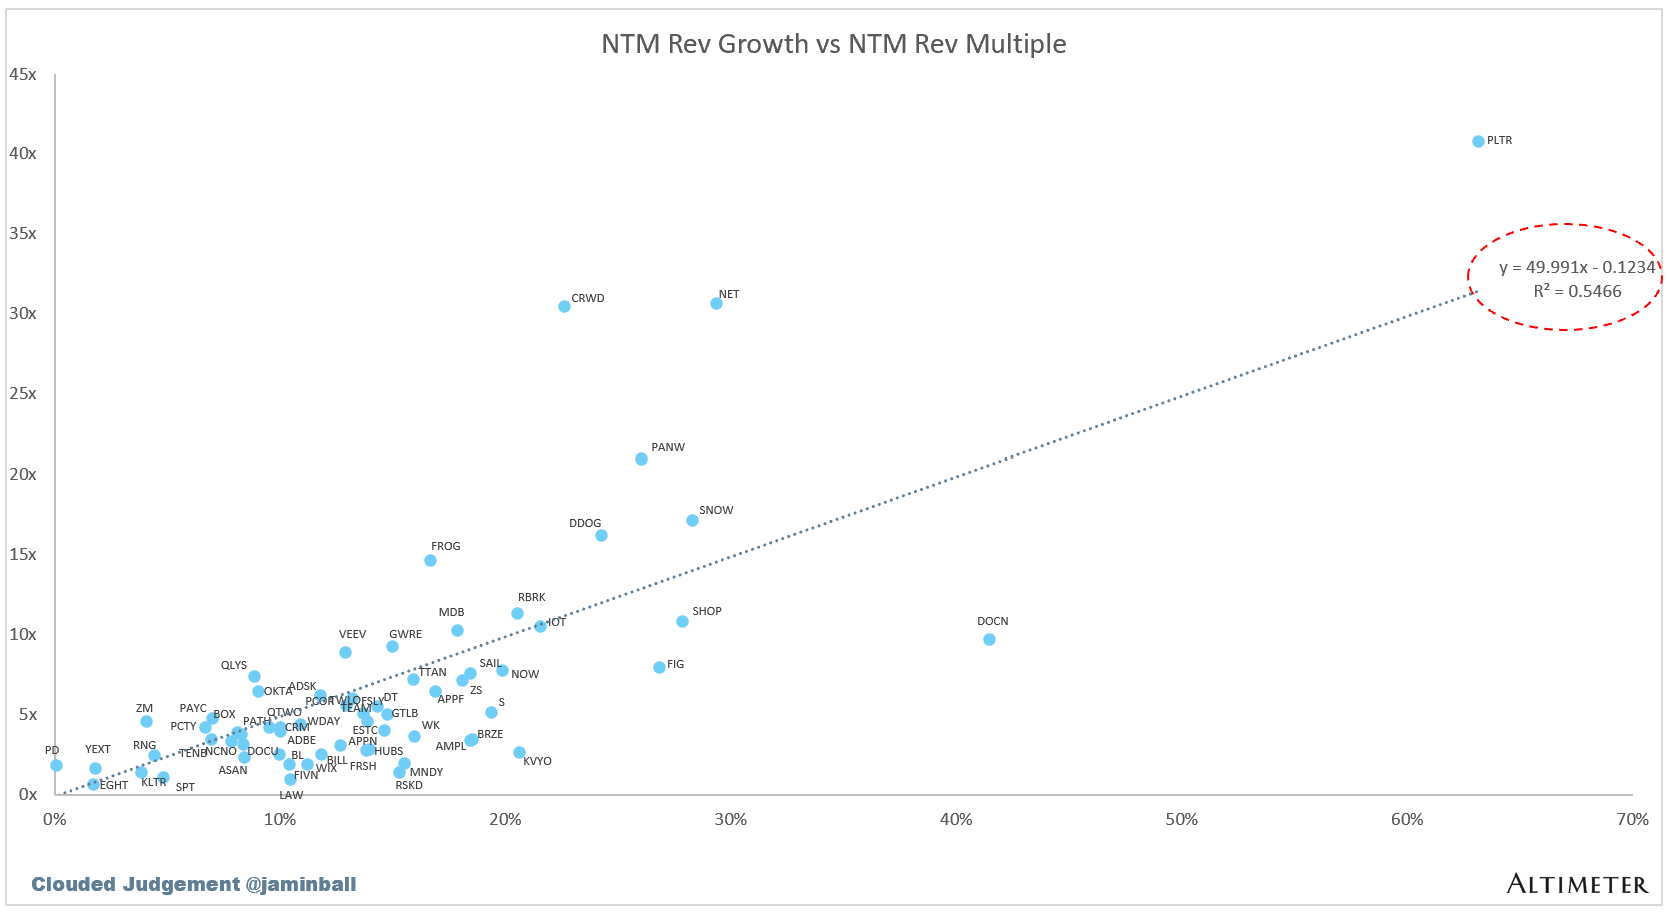
Scatter Plot of EV / NTM Rev Multiple vs NTM Rev Growth
How correlated is growth to valuation multiple?
Operating Metrics
Median NTM growth rate: 13%
Median LTM growth rate: 16%
Median Gross Margin: 76%
Median Operating Margin 2%
Median FCF Margin: 21%
Median Net Retention: 110%
Median CAC Payback: 44 months
Median S&M % Revenue: 34%
Median R&D % Revenue: 23%
Median G&A % Revenue: 13%
Comps Output
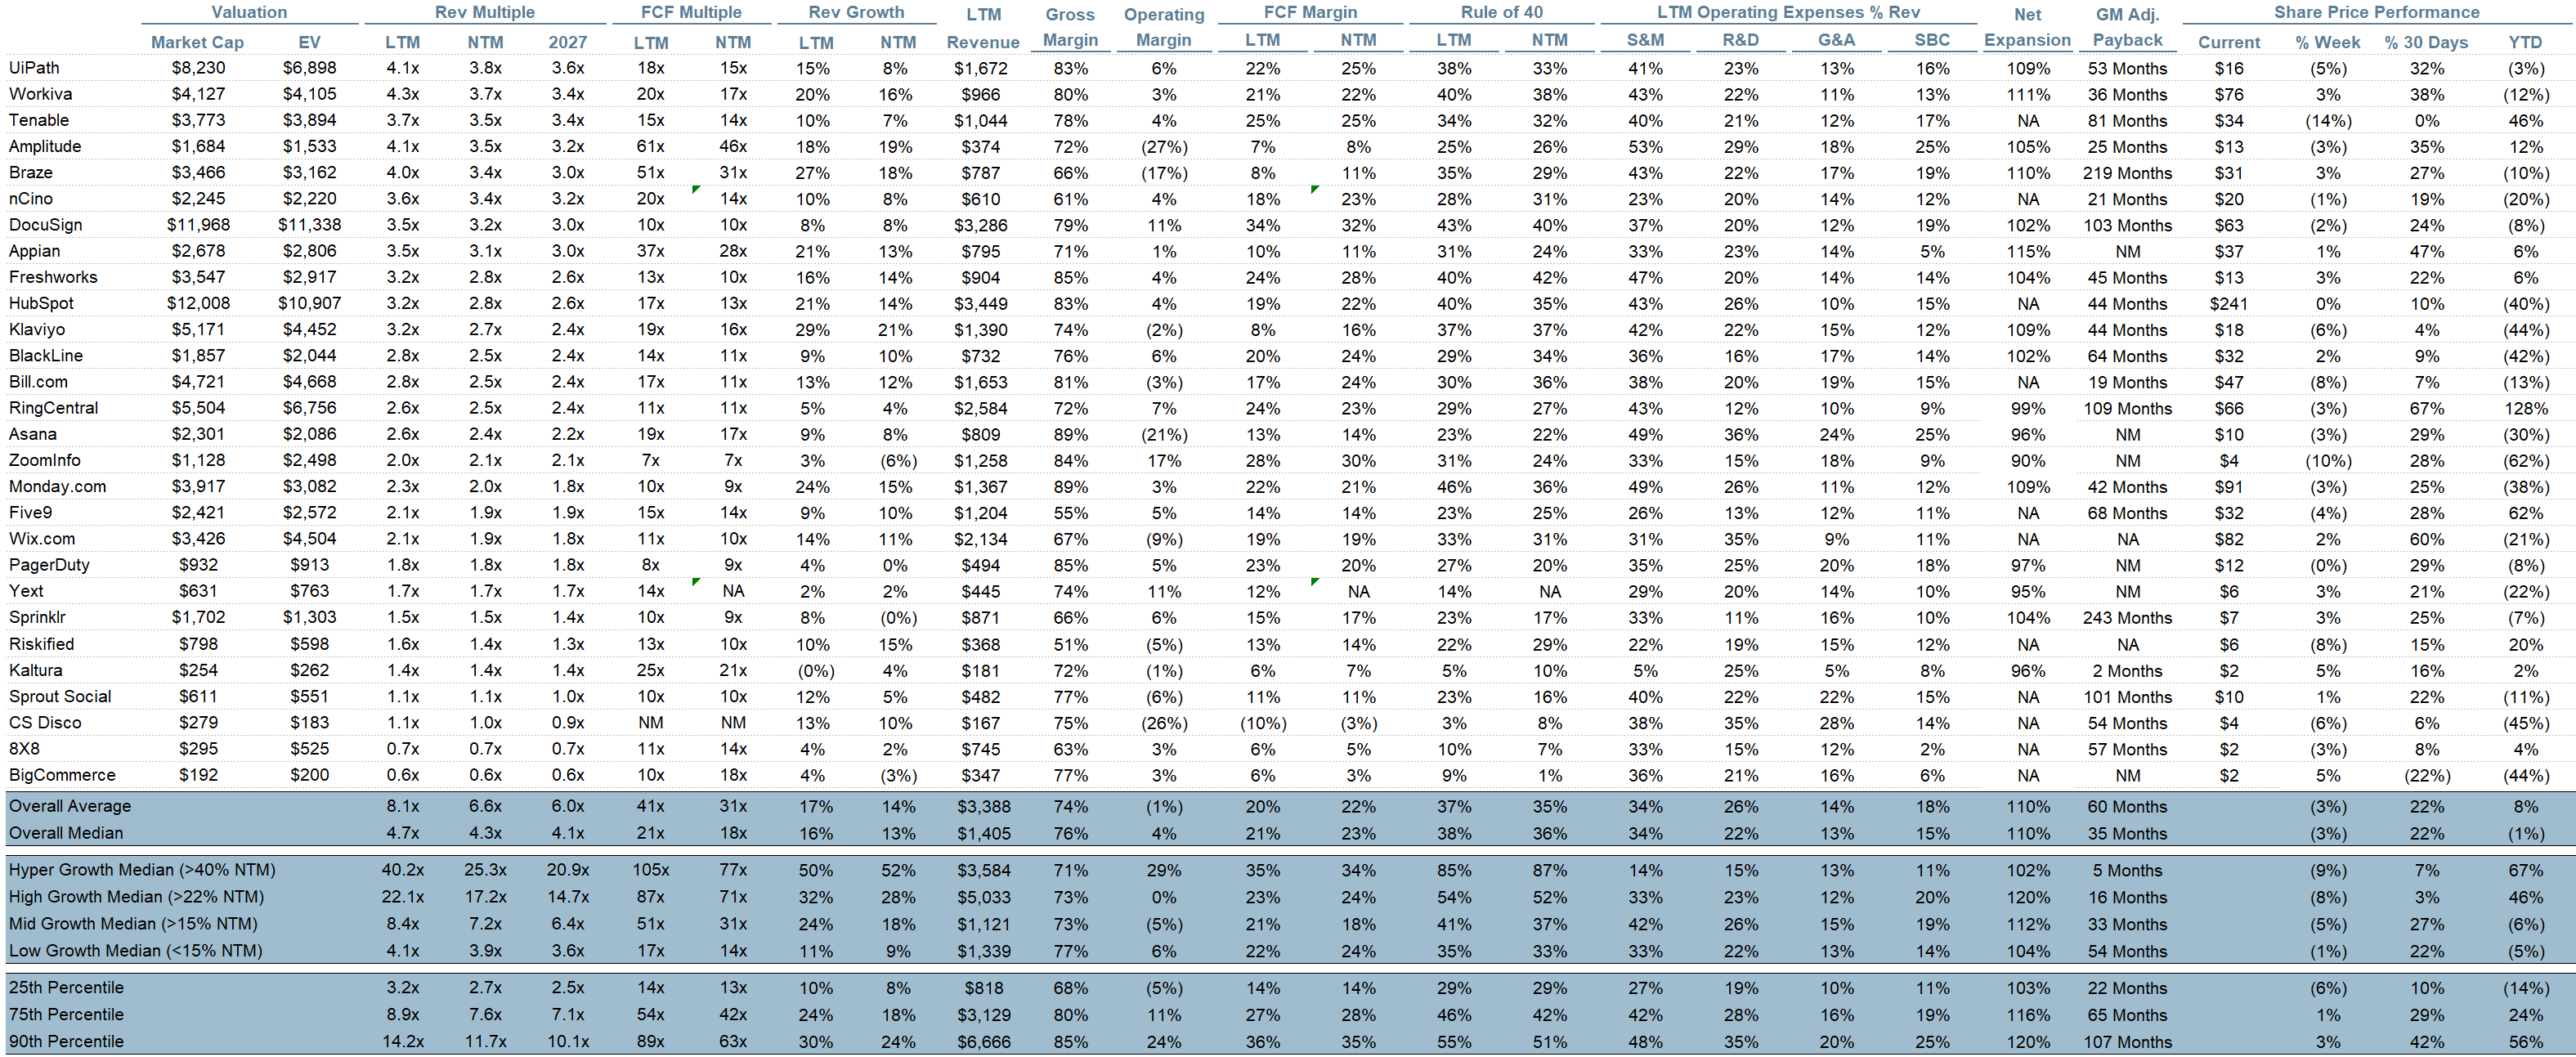
Rule of 40 shows rev growth + FCF margin (both LTM and NTM for growth + margins). FCF calculated as Cash Flow from Operations - Capital Expenditures
GM Adjusted Payback is calculated as: (Previous Q S&M) / (Net New ARR in Q x Gross Margin) x 12. It shows the number of months it takes for a SaaS business to pay back its fully burdened CAC on a gross profit basis. Most public companies don’t report net new ARR, so I’m taking an implied ARR metric (quarterly subscription revenue x 4). Net new ARR is simply the ARR of the current quarter, minus the ARR of the previous quarter. Companies that do not disclose subscription rev have been left out of the analysis and are listed as NA.
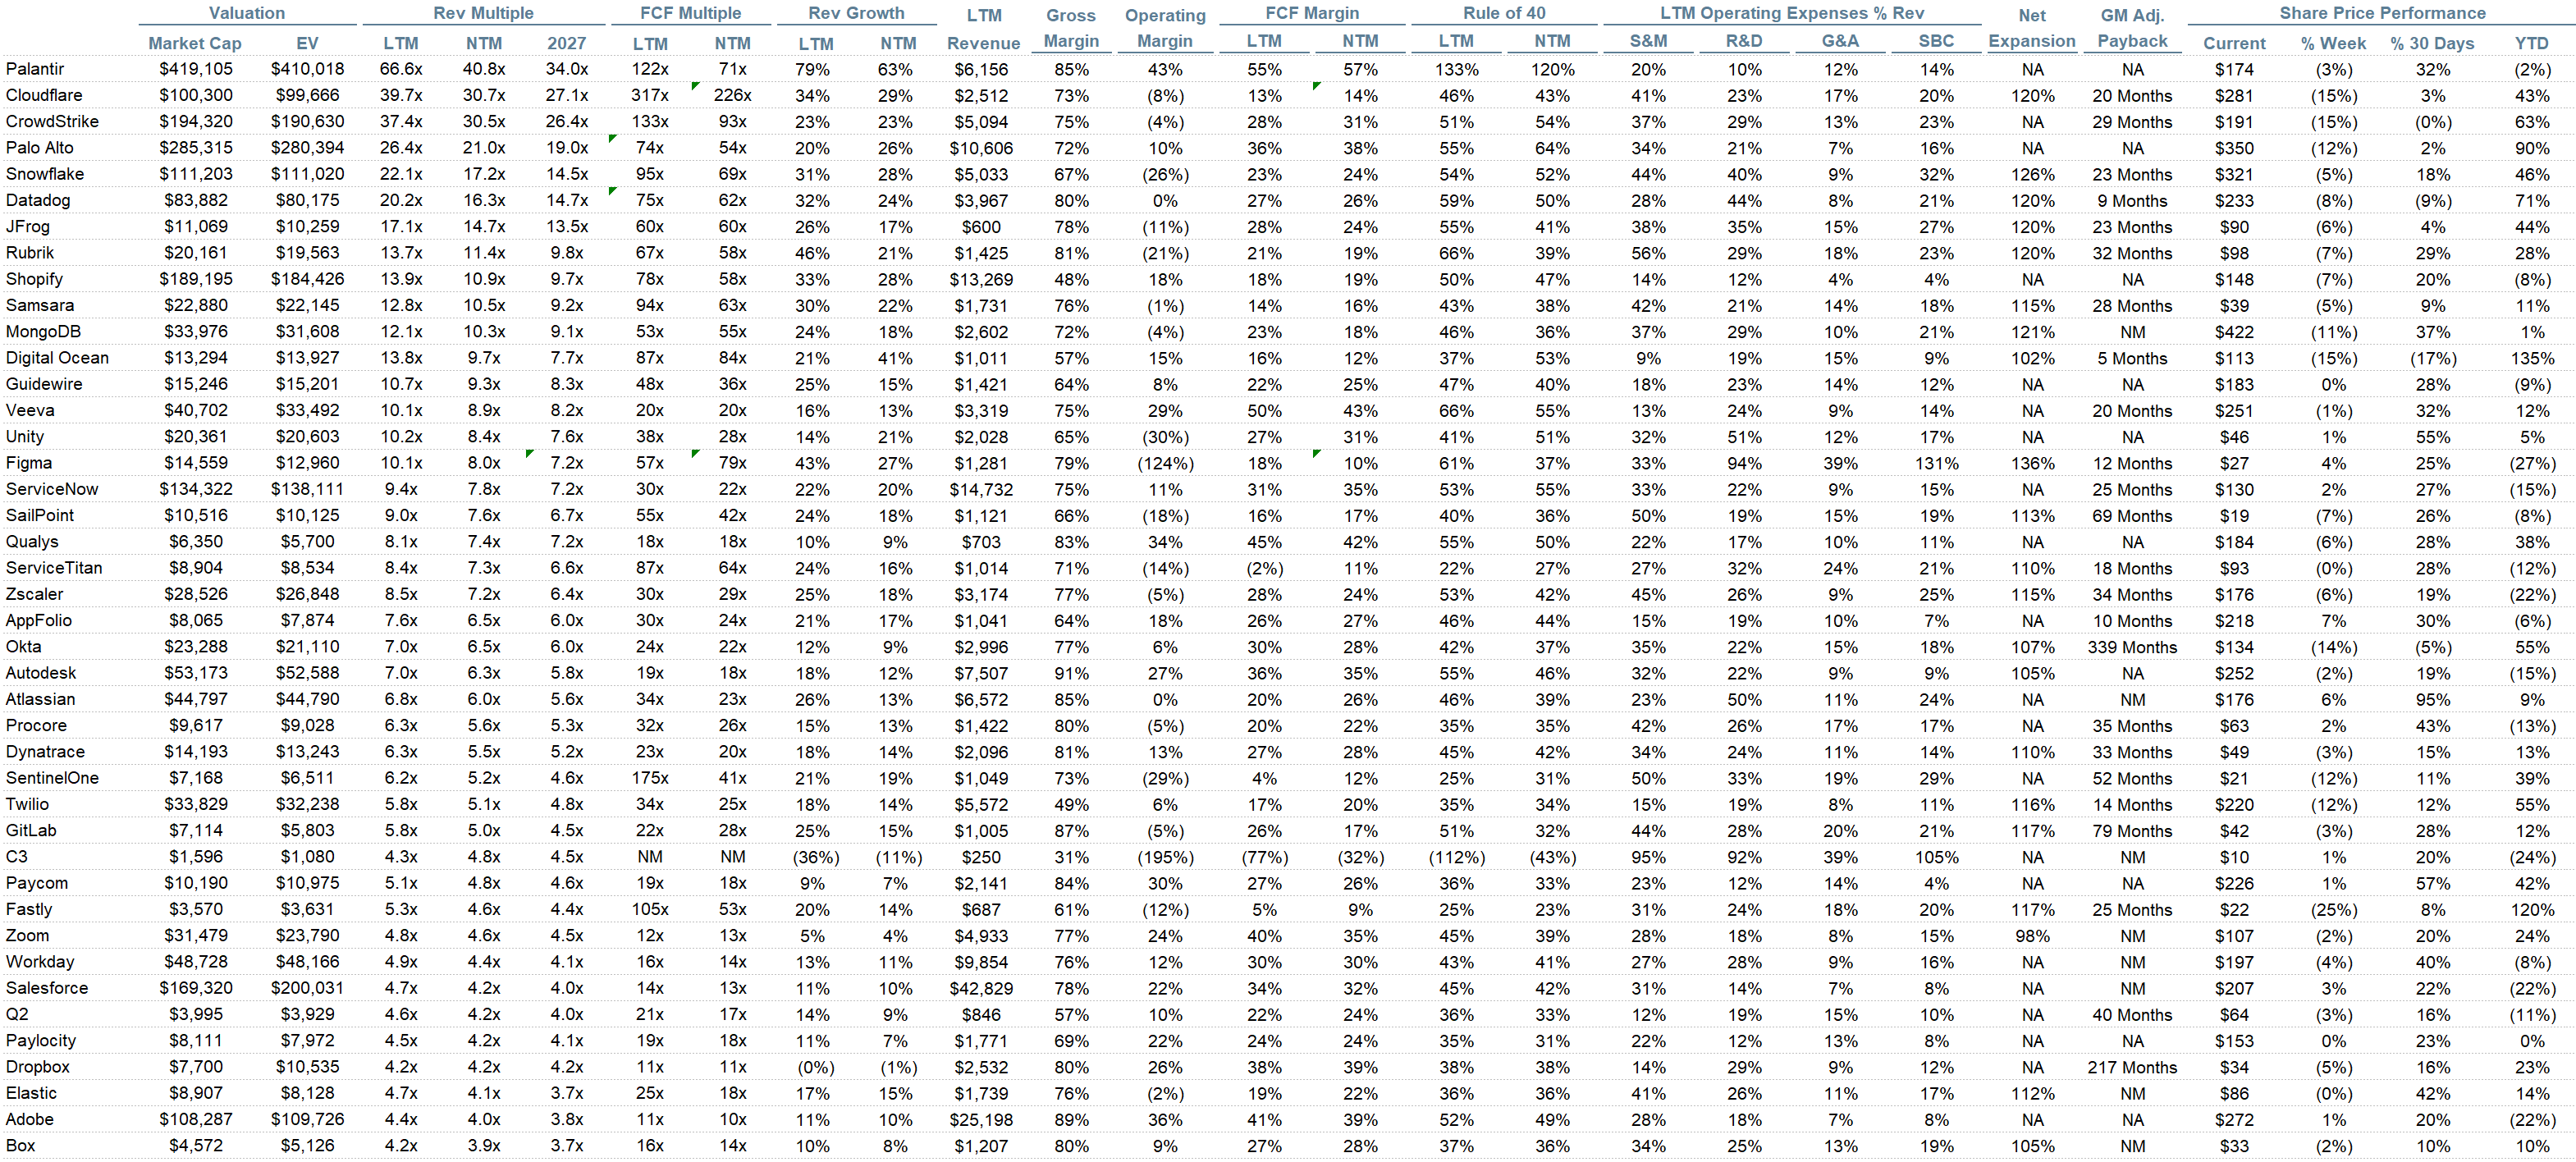
Sources used in this post include Bloomberg, Pitchbook and company filings
The information presented in this newsletter is the opinion of the author and does not necessarily reflect the view of any other person or entity, including Altimeter Capital Management, LP (”Altimeter”). The information provided is believed to be from reliable sources but no liability is accepted for any inaccuracies. This is for information purposes and should not be construed as an investment recommendation. Past performance is no guarantee of future performance. Altimeter is an investment adviser registered with the U.S. Securities and Exchange Commission. Registration does not imply a certain level of skill or training. Altimeter and its clients trade in public securities and have made and/or may make investments in or investment decisions relating to the companies referenced herein. The views expressed herein are those of the author and not of Altimeter or its clients, which reserve the right to make investment decisions or engage in trading activity that would be (or could be construed as) consistent and/or inconsistent with the views expressed herein.
This post and the information presented are intended for informational purposes only. The views expressed herein are the author’s alone and do not constitute an offer to sell, or a recommendation to purchase, or a solicitation of an offer to buy, any security, nor a recommendation for any investment product or service. While certain information contained herein has been obtained from sources believed to be reliable, neither the author nor any of his employers or their affiliates have independently verified this information, and its accuracy and completeness cannot be guaranteed. Accordingly, no representation or warranty, express or implied, is made as to, and no reliance should be placed on, the fairness, accuracy, timeliness or completeness of this information. The author and all employers and their affiliated persons assume no liability for this information and no obligation to update the information or analysis contained herein in the future.