Clouded Judgement 8.9.24 - Zombies
Every week I’ll provide updates on the latest trends in cloud software companies. Follow along to stay up to date!
Zombies
Software companies don't die easily. And neither do Zombies.
Today, companies large and small are asking questions like “how should I balance growth vs profitability” or “what metrics will it take to raise my next round.” These are all important questions, but not THE question. THE question should always be “what’s my right to exist over the next 5-10 years - and how will I drive incremental enterprise value in that timeframe.” This is the existential question. I get it’s two questions not one, but they’re related :)
Today, unfortunately, the private markets are flooded with companies that might not have a right to exist in 5-10 years. More and more of my conversations with other venture investors include some form of “what’s going to happen to all the zombie private companies?!” What’s a zombie? A zombie is a company that (in it’s current form) is not attractive to public markets or acquirers. There are so many companies sitting in the $50m - $300m ARR range, growing <20%, and burning money or barely breakeven. Lower growth is OK if you’ve hit significant scale and have shown platform power (ie super sticky / hard to rip out revenue). Being subscale with low growth is a difficult combo. So what’s the exit path for that profile? In public markets it’s hard to see those companies trading >2-3x revenue. Low growth businesses tend to trade on a profitability metric not a revenue metric. On the acquisition side, there are different challenges. For strategic buyers (ie other software companies), they may be interested in these acquisitions, but again at lower multiples. And they generally prefer smaller acquisitions where it’s easier to integrate the product. Financial buyers (private equity) probably don’t find the low growth / limited profitability attractive. They’re great at “professionalizing” companies and removing costs to drive margins. But it’s A LOT harder to re-accelerate growth (let alone do both at the same time). So again, they MAY be buyers, but not at high multiples. There seems to be a lot of hopeium that all the dry powder sitting in private equity funds will come and save the venture funds. I’m not holding my breath… HG acquired AuditBoard earlier this year for >$3b. As I understand it, the company had solid organic growth and real profitability.
There will be some of these zombies that do in fact reaccelerate growth. It’s just VERY hard to do.
Today, there’s something like ~1,400 private unicorns. I have no idea how many are software, but let’s assume ~60% (that could be way off, I’m just guessing). So call it ~850 private software unicorns. Today, there are ~100 public software companies. If the universe of public software companies were to DOUBLE, that implies only ~10% of the current universe of private unicorns make it public. I’d guess the reality is closer to 5% or lower end up making it public.
So what do these private companies do? The first step is having an intellectually honest conversation about your odds of making it through the “zombie zone.” Do you really have a path to reinvent yourself, or find another vector of growth? Is your growth temporarily stunted by vertical market idiosyncrasies? Founders have incredible conviction and resilience - so I’d never count one out. But, most companies won’t be able to reaccelerate. And just because you’re growing doesn’t mean you’re creating incremental enterprise value. There are many companies who grow top line (but growth rates decay), who’s valuation stays flat. As the absolute value of top line increase, the multiple decreases, and it all nets out to a similar flat valuation. You’re surviving, but not really living. Software companies are hard to kill. While churn has picked up, for the most part companies still have net retentions >100% (although there are a lot more these days that don’t…). This means it will be a longggg time before the company truly goes out of business (if ever). However, back to the beginning, the big question is what is my right to exist, and how will I create value over the medium term. The last thing anyone wants to do is grind for 5 years creating no incremental economic value for shareholders (themselves included).
One path I think should happen - is private / private mergers. Not acquisitions, but mergers. So many markets in software are overcrowded point solutions creating a race to the bottom on price and profits. Maybe, a few of these could join forces to create a platform? Much much harder done than said… I just don’t see PE being a shiny knight coming in to save the day… Not at attractive valuations at least.
If a merger is not an option, I’m not quite sure what the best options are. I do think the right path forward is maximizing value in the short term through an exit, one way or another. That’s probably acquisition at a suboptimal price, something significantly lower than your last round of funding. It will feel painful, but it’s probably better than being a zombie. The biggest opportunity cost in life is our time, so best to make the most of it.
I also have a hard time suggesting the best thing to do is sell now, at a market low. The environment is still very hard. Q4 last year was a total head fake with budget flush. We maybe saw the light at the end of the tunnel, but what I’ve observed in Q1 / Q2 so far this year is that it remains really hard out there in software land! And it’s not obvious when it will improve. In the public universe, 58% of software companies who guided Q3 revenue guided below consensus estimates! This is historically bad and one of the worst quarters ever. Inevitably, times will change. Software is cyclical. Rates will fall (which will have a lot of cascading effects on budgets / buying behaviors). But who knows when, and who knows why. Rates may fall because we enter a recession - and exit valuations certainly won’t increase in a recession regardless of where rates are. A year from now very well may be a better time to try and maximize an exit value! But no one knows for sure.
At the end of the day, hope is not a strategy. We can’t hope for a better macro environment or that a company will catch lightening in a bottle on a second product line. For companies, the big question to ask is what is my right to exist in 5 years, and if the answer isn’t obvious then companies have some hard discussions to have.
Quarterly Reports Summary
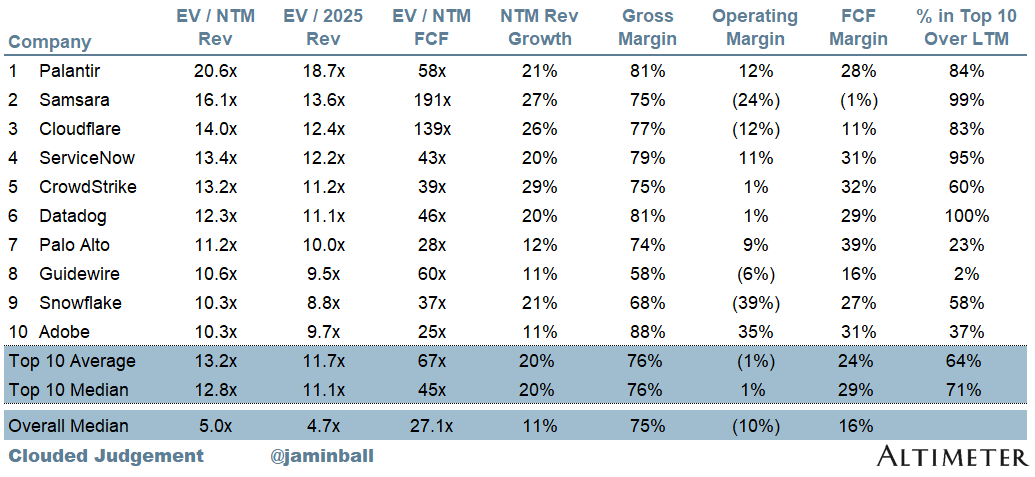
Top 10 EV / NTM Revenue Multiples
Top 10 Weekly Share Price Movement
Update on Multiples
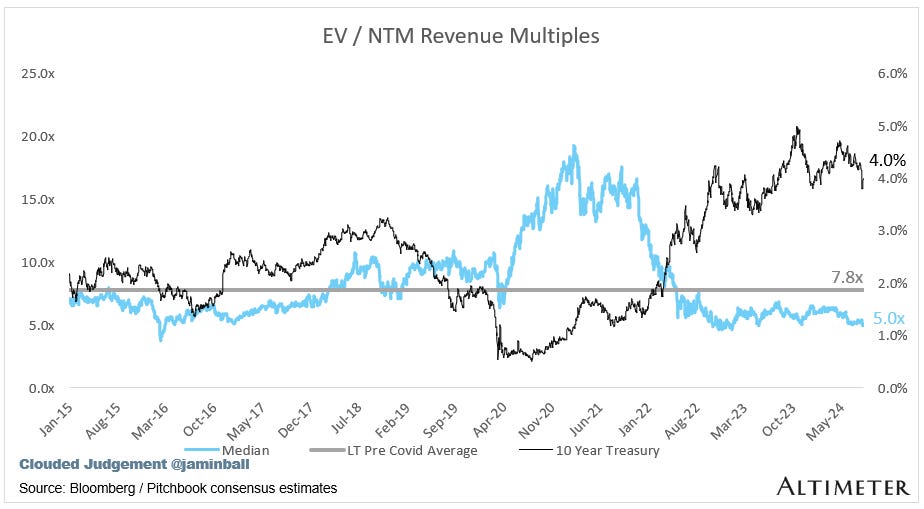
SaaS businesses are generally valued on a multiple of their revenue - in most cases the projected revenue for the next 12 months. Revenue multiples are a shorthand valuation framework. Given most software companies are not profitable, or not generating meaningful FCF, it’s the only metric to compare the entire industry against. Even a DCF is riddled with long term assumptions. The promise of SaaS is that growth in the early years leads to profits in the mature years. Multiples shown below are calculated by taking the Enterprise Value (market cap + debt - cash) / NTM revenue.
Overall Stats:
Overall Median: 5.0x
Top 5 Median: 14.0x
10Y: 4.0%
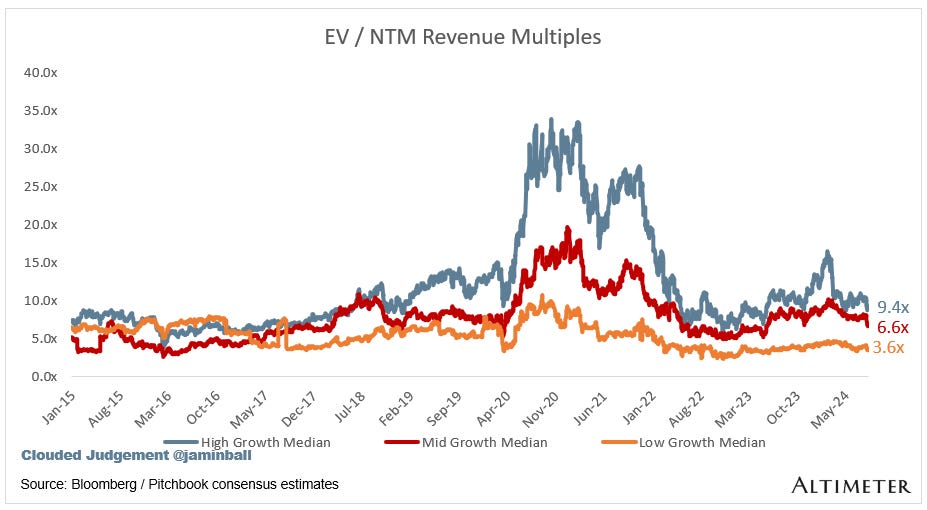
Bucketed by Growth. In the buckets below I consider high growth >27% projected NTM growth (I had to update this, as there’s only 1 company projected to grow >30% after this quarter’s earnings), mid growth 15%-27% and low growth <15%
High Growth Median: 9.4x
Mid Growth Median: 6.6x
Low Growth Median: 3.6x
EV / NTM Rev / NTM Growth
The below chart shows the EV / NTM revenue multiple divided by NTM consensus growth expectations. So a company trading at 20x NTM revenue that is projected to grow 100% would be trading at 0.2x. The goal of this graph is to show how relatively cheap / expensive each stock is relative to their growth expectations
EV / NTM FCF
The line chart shows the median of all companies with a FCF multiple >0x and <100x. I created this subset to show companies where FCF is a relevant valuation metric.
Companies with negative NTM FCF are not listed on the chart
Scatter Plot of EV / NTM Rev Multiple vs NTM Rev Growth
How correlated is growth to valuation multiple?
Operating Metrics
Median NTM growth rate: 11%
Median LTM growth rate: 16%
Median Gross Margin: 75%
Median Operating Margin (10%)
Median FCF Margin: 16%
Median Net Retention: 110%
Median CAC Payback: 58 months
Median S&M % Revenue: 40%
Median R&D % Revenue: 25%
Median G&A % Revenue: 17%
Comps Output
Rule of 40 shows rev growth + FCF margin (both LTM and NTM for growth + margins). FCF calculated as Cash Flow from Operations - Capital Expenditures
GM Adjusted Payback is calculated as: (Previous Q S&M) / (Net New ARR in Q x Gross Margin) x 12 . It shows the number of months it takes for a SaaS business to payback their fully burdened CAC on a gross profit basis. Most public companies don’t report net new ARR, so I’m taking an implied ARR metric (quarterly subscription revenue x 4). Net new ARR is simply the ARR of the current quarter, minus the ARR of the previous quarter. Companies that do not disclose subscription rev have been left out of the analysis and are listed as NA.
Sources used in this post include Bloomberg, Pitchbook and company filings
The information presented in this newsletter is the opinion of the author and does not necessarily reflect the view of any other person or entity, including Altimeter Capital Management, LP ("Altimeter"). The information provided is believed to be from reliable sources but no liability is accepted for any inaccuracies. This is for information purposes and should not be construed as an investment recommendation. Past performance is no guarantee of future performance. Altimeter is an investment adviser registered with the U.S. Securities and Exchange Commission. Registration does not imply a certain level of skill or training.
This post and the information presented are intended for informational purposes only. The views expressed herein are the author’s alone and do not constitute an offer to sell, or a recommendation to purchase, or a solicitation of an offer to buy, any security, nor a recommendation for any investment product or service. While certain information contained herein has been obtained from sources believed to be reliable, neither the author nor any of his employers or their affiliates have independently verified this information, and its accuracy and completeness cannot be guaranteed. Accordingly, no representation or warranty, express or implied, is made as to, and no reliance should be placed on, the fairness, accuracy, timeliness or completeness of this information. The author and all employers and their affiliated persons assume no liability for this information and no obligation to update the information or analysis contained herein in the future.


Jamin, during earnings season, there are two tables in your weekly posts that are of prime value to me.
1. Quarterly Reports Summary table tells me if any company has had a >5-7% upside or downside surprise in revenues or earnings. Imo, those are the companies to buy or avoid. Everyone else is just playing the guidance/outlook/estimate game between WS analysts and mgmt.
2. Top 10 EV / NTM Revenue Multiples which shows me which are likely the most overvalued stocks in the universe that you track. Interestingly, almost always the top 2-3 companies on that list get cut down to size sooner rather than later.
Thanks for the excellent content you continue to post. Cheers!
Good post!