

Every week I’ll provide updates on the latest trends in cloud software companies. Follow along to stay up to date!
Paying for the Curve
Lots of drama this week on math proofs! I’m sure most have seen the back and forth between folks at OpenAI and Anthropic about a Navier Stokes proof. The point of this post is not to dig in on all the details (too much commentary on that online already, and too much speculation…) Instead - here’s a very high level of one part of the saga (and then something that I found interesting). Producing a proof of the Navier Stokes existence and smoothness problem is one of seven Millennium Prize Problems that each have a $1m prize attached to it (ie solve it, get a $1m prize). And OpenAI said they did it. 10k agents working in parallel for 3-4 days, >100 pages of manuscript and a formalized proof. The drama around this are allegations that OpenAI piggybacked off research two professors had done (but not published) on the same topic (one of whom works at Anthropic).
Who gets credit, how it got discovered, etc, are not what I want to discuss today. What was interesting to me was how much of the commentary online centered around the cost / benefit of producing this proof. The “benefit” was the $1m prize. But at what cost? OpenAI said the agents sent ~2.7m messages and used ~130b output tokens. Many posts then attempted to do the math on the “cost” of solving this problem. At Astra’s list price of ~$50m / million output tokens, the 130b output tokens cost is ~$6.5m. That’s just output though. The input tokens for 2.7m messages passing context back and forth is most likely a much larger number. All in the total costs estimated from $10 - $40m. OpenAI has said that it was in the ballpark of “millions of dollars” of compute.
The lazy takes then become - “wait, they spent ~$10m+ to win a prize worth $1m?! How is that worth it!” Sam Altman even poked fun at people making these claims:

The broader point I want to make - for the most important breakthroughs, the “cost” of the first wave is never really that relevant. What’s most relevant is the binary - could we do it, and what’s the slope of the curve.
Noam Brown described this well. He talked about when OpenAI announced o3 in December ‘24 it cost $500k of compute to score 87.5% on ARC-AGI 1. Today, Astra scores higher for $20. In ‘25, OpenAI and DeepMind spent a ton of compute to get to IMO gold. For the 2026 IMP, anyone with a $20 / month ChatGPT subscription could do it. This is a pattern that will continue to repeat itself. Sure, maybe it cost $10m to solve Navier- Stokes today for a $1m prize. The focus should be on “look what a computer just did!” Not on “but look how much it cost.” Because the trend seems pretty clear - now that we’ve shown computers can solve problems of this difficulty, it should be obvious they will continue to solve more problems of this difficulty but at exponentially lower costs as time progresses. Epoch AI has the price to reach a given benchmark falling from 9x to 900x per year (depending on the milestone). GPT-4 came out in early 2023 at $60m / 1m output tokens. Now you can get that level of performance for <$1.
So let’s extrapolate this. This year it costs ~$10m to solve a Millennium Prize Problem. Next year it’s $1m. Year after that $100k. Year after that $10k. This specific trajectory of course won’t be exactly right, but the shape of it probably will be. Something that was once very out of reach for the vast majority of the population ($10m dollars, 10k agents, days of running time, etc) will (before long) cost less than a new foldable iphone and be accessible to everyone. That’s the real takeaway for me! And everyone just focusing on the mismatch in $1m price to cost spent is just completely missing the forest for the trees (or intentionally being dogmatic).
Tying this back to another (hotly) debated topic in AI - gross margins. Today, many folks will look at AI businesses with low gross margins and see a “broken business.” But this is making the same mistake as the cost / prize of the math proof I described above… Gross margins are point in time on a curve, and the cost of that curve is falling dramatically.
The pace of innovation is staggering, and only accelerating. Too often analysis of the industry looks at point in time metrics, and not at where things are heading. And the “where things are heading” can be tricky when the slope of the exponential is so steep. Last thing I’ll end with (maybe most important) - Noam also mentioned the model used at OpenAI for the proof was an unreleased model more powerful than astra (you can see his chart below). There are models that exist today that are already meaningfully more performant than what’s out in the public. The pace of the exponential will only steepen from here!


Quarterly Reports Summary

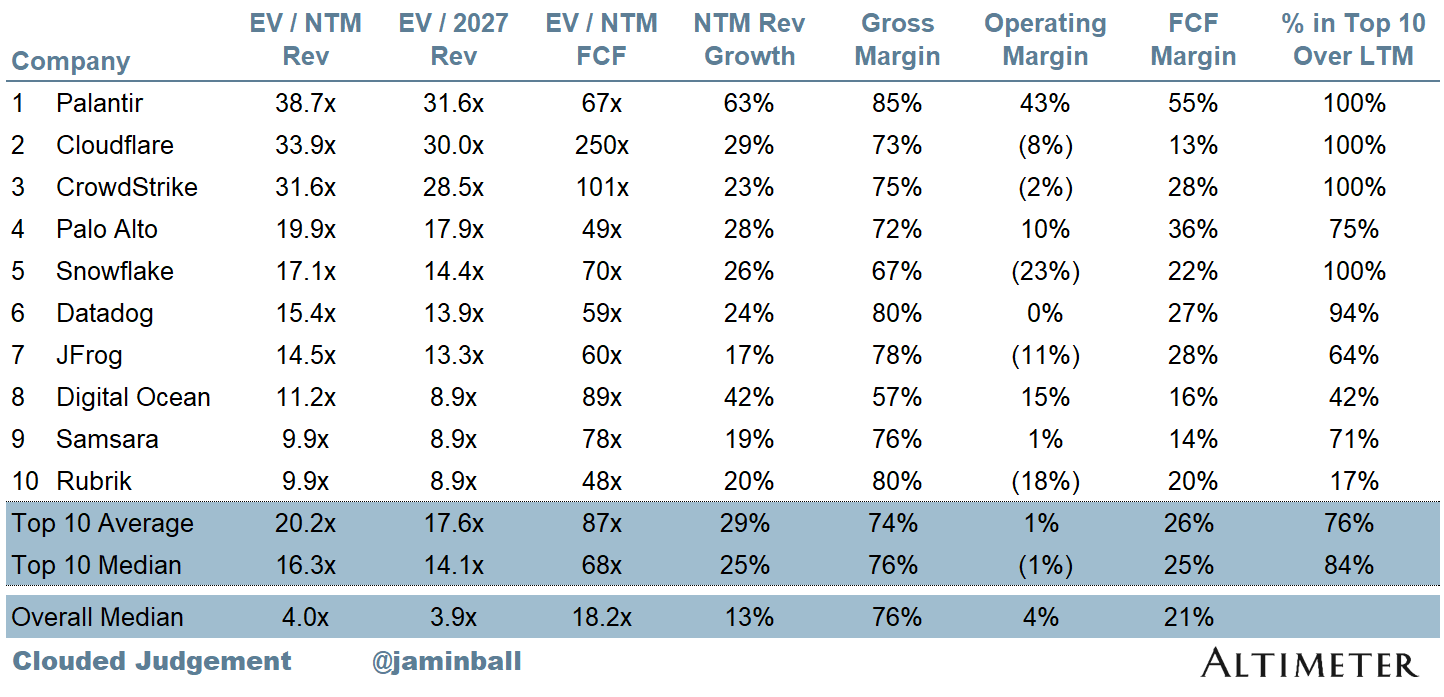
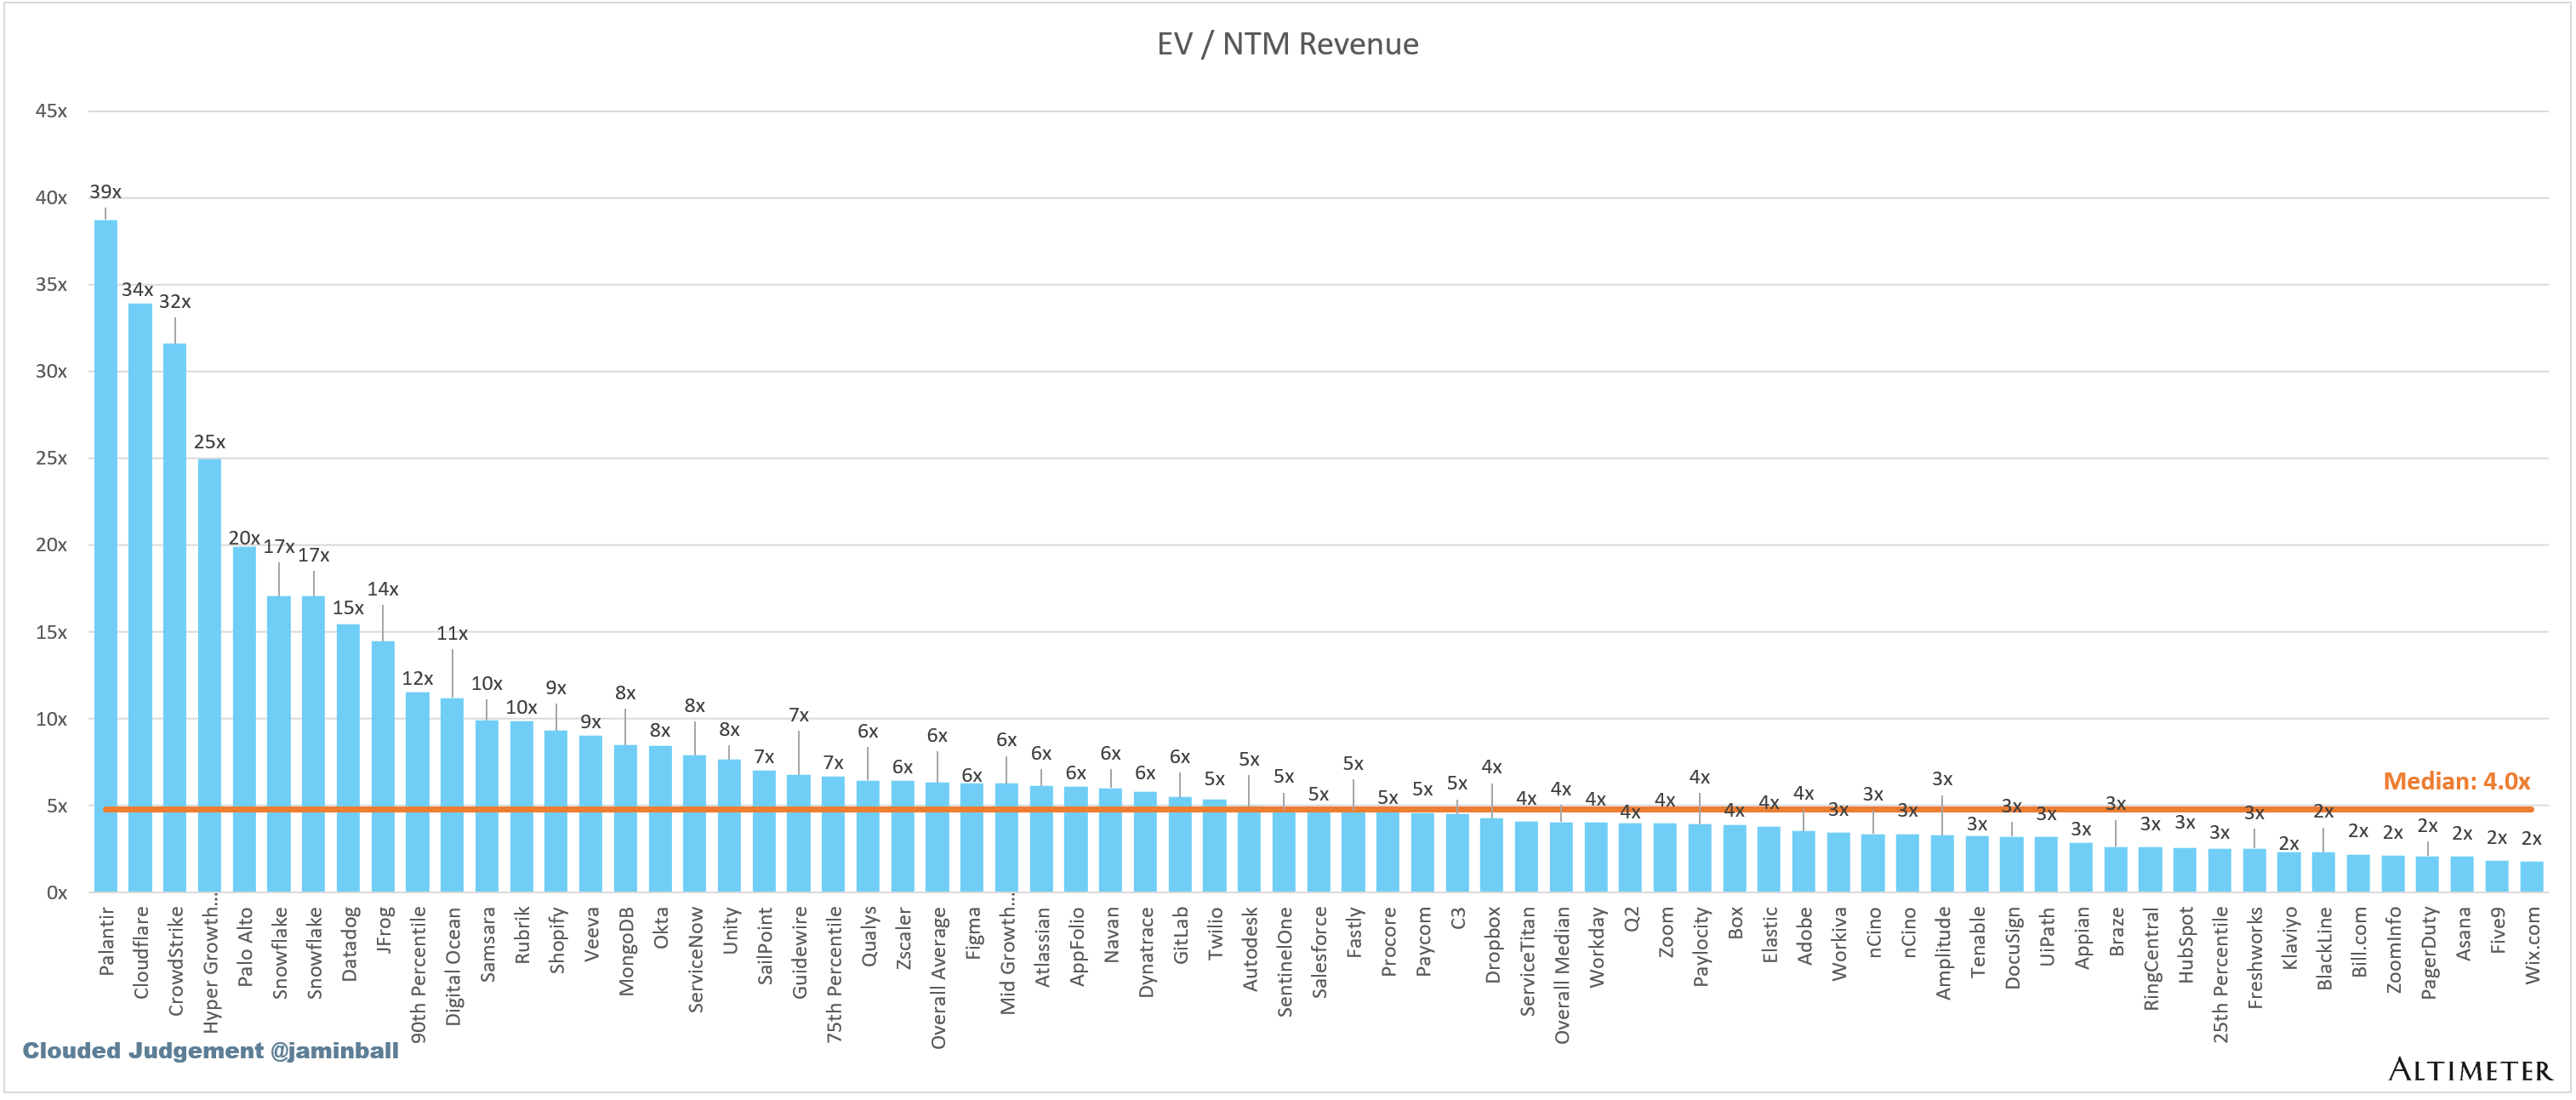
Top 10 EV / NTM Revenue Multiples
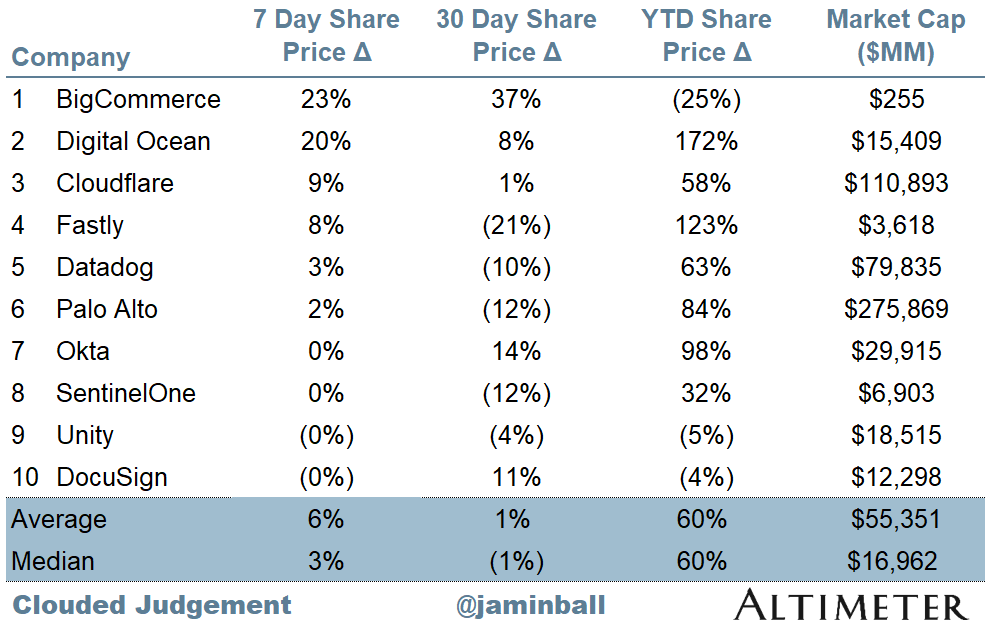
Top 10 Weekly Share Price Movement
Update on Multiples
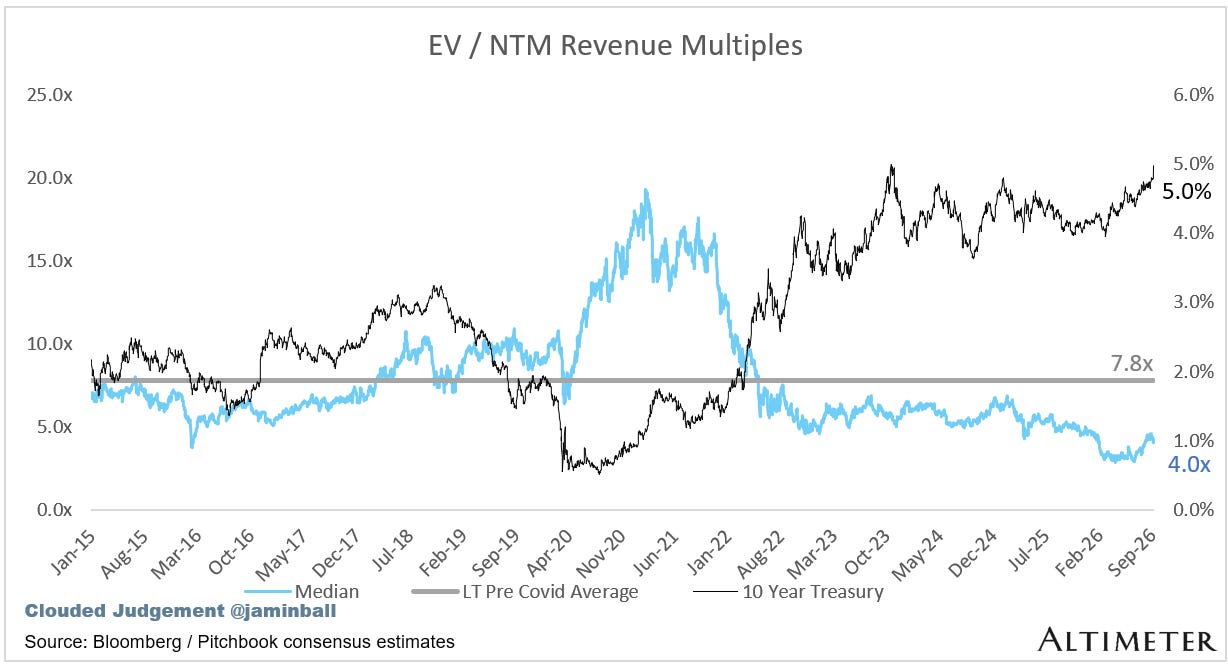
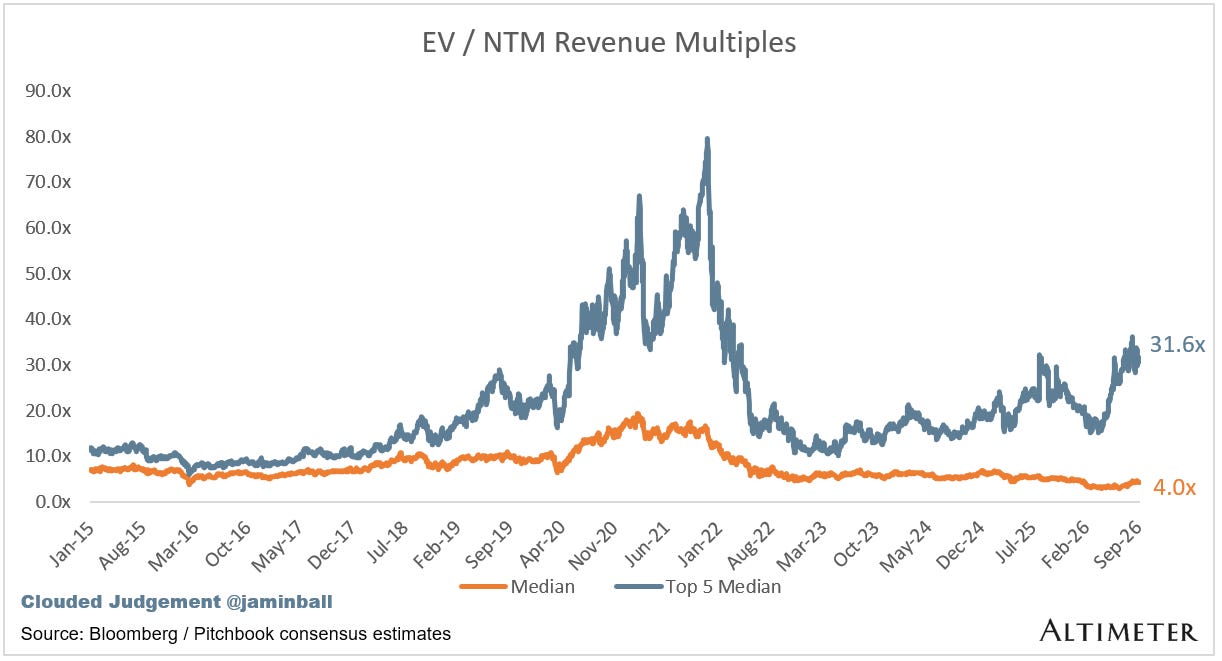
SaaS businesses are generally valued on a multiple of their revenue - in most cases the projected revenue for the next 12 months. Revenue multiples are a shorthand valuation framework. Given most software companies are not profitable, or not generating meaningful FCF, it’s the only metric to compare the entire industry against. Even a DCF is riddled with long term assumptions. The promise of SaaS is that growth in the early years leads to profits in the mature years. Multiples shown below are calculated by taking the Enterprise Value (market cap + debt - cash) / NTM revenue.
Overall Stats:
Overall Median: 4.0x
Top 5 Median: 31.6x
10Y: 5.0%
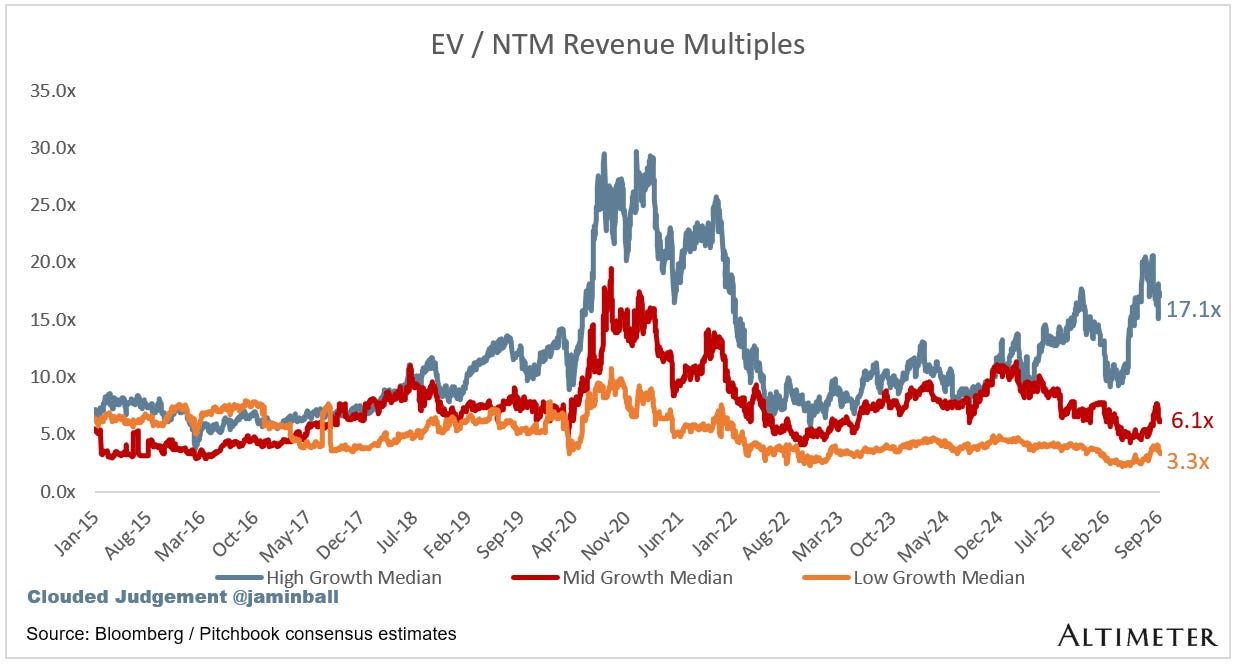
Bucketed by Growth. In the buckets below I consider high growth >22% projected NTM growth, mid growth 15%-22% and low growth <15%. I had to adjusted the cut off for “high growth.” If 22% feels a bit arbitrary, it’s because it is…I just picked a cutoff where there were ~10 companies that fit into the high growth bucket so the sample size was more statistically significant
High Growth Median: 17.1x
Mid Growth Median: 6.1x
Low Growth Median: 3.3x
EV / NTM Rev / NTM Growth
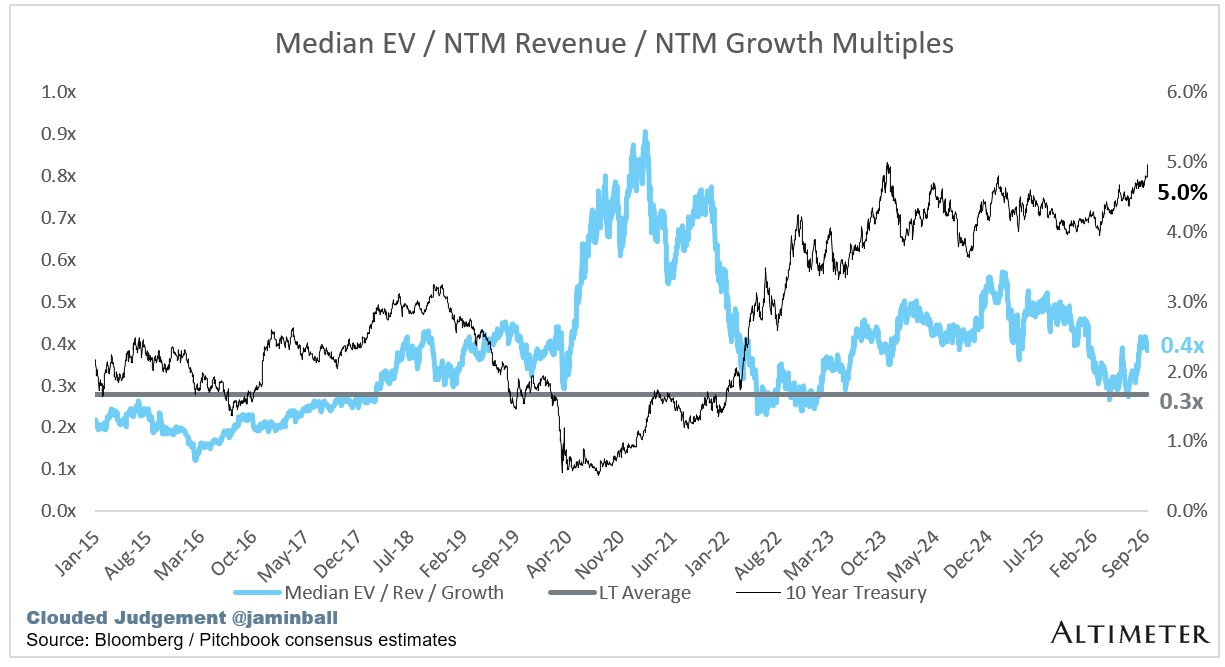
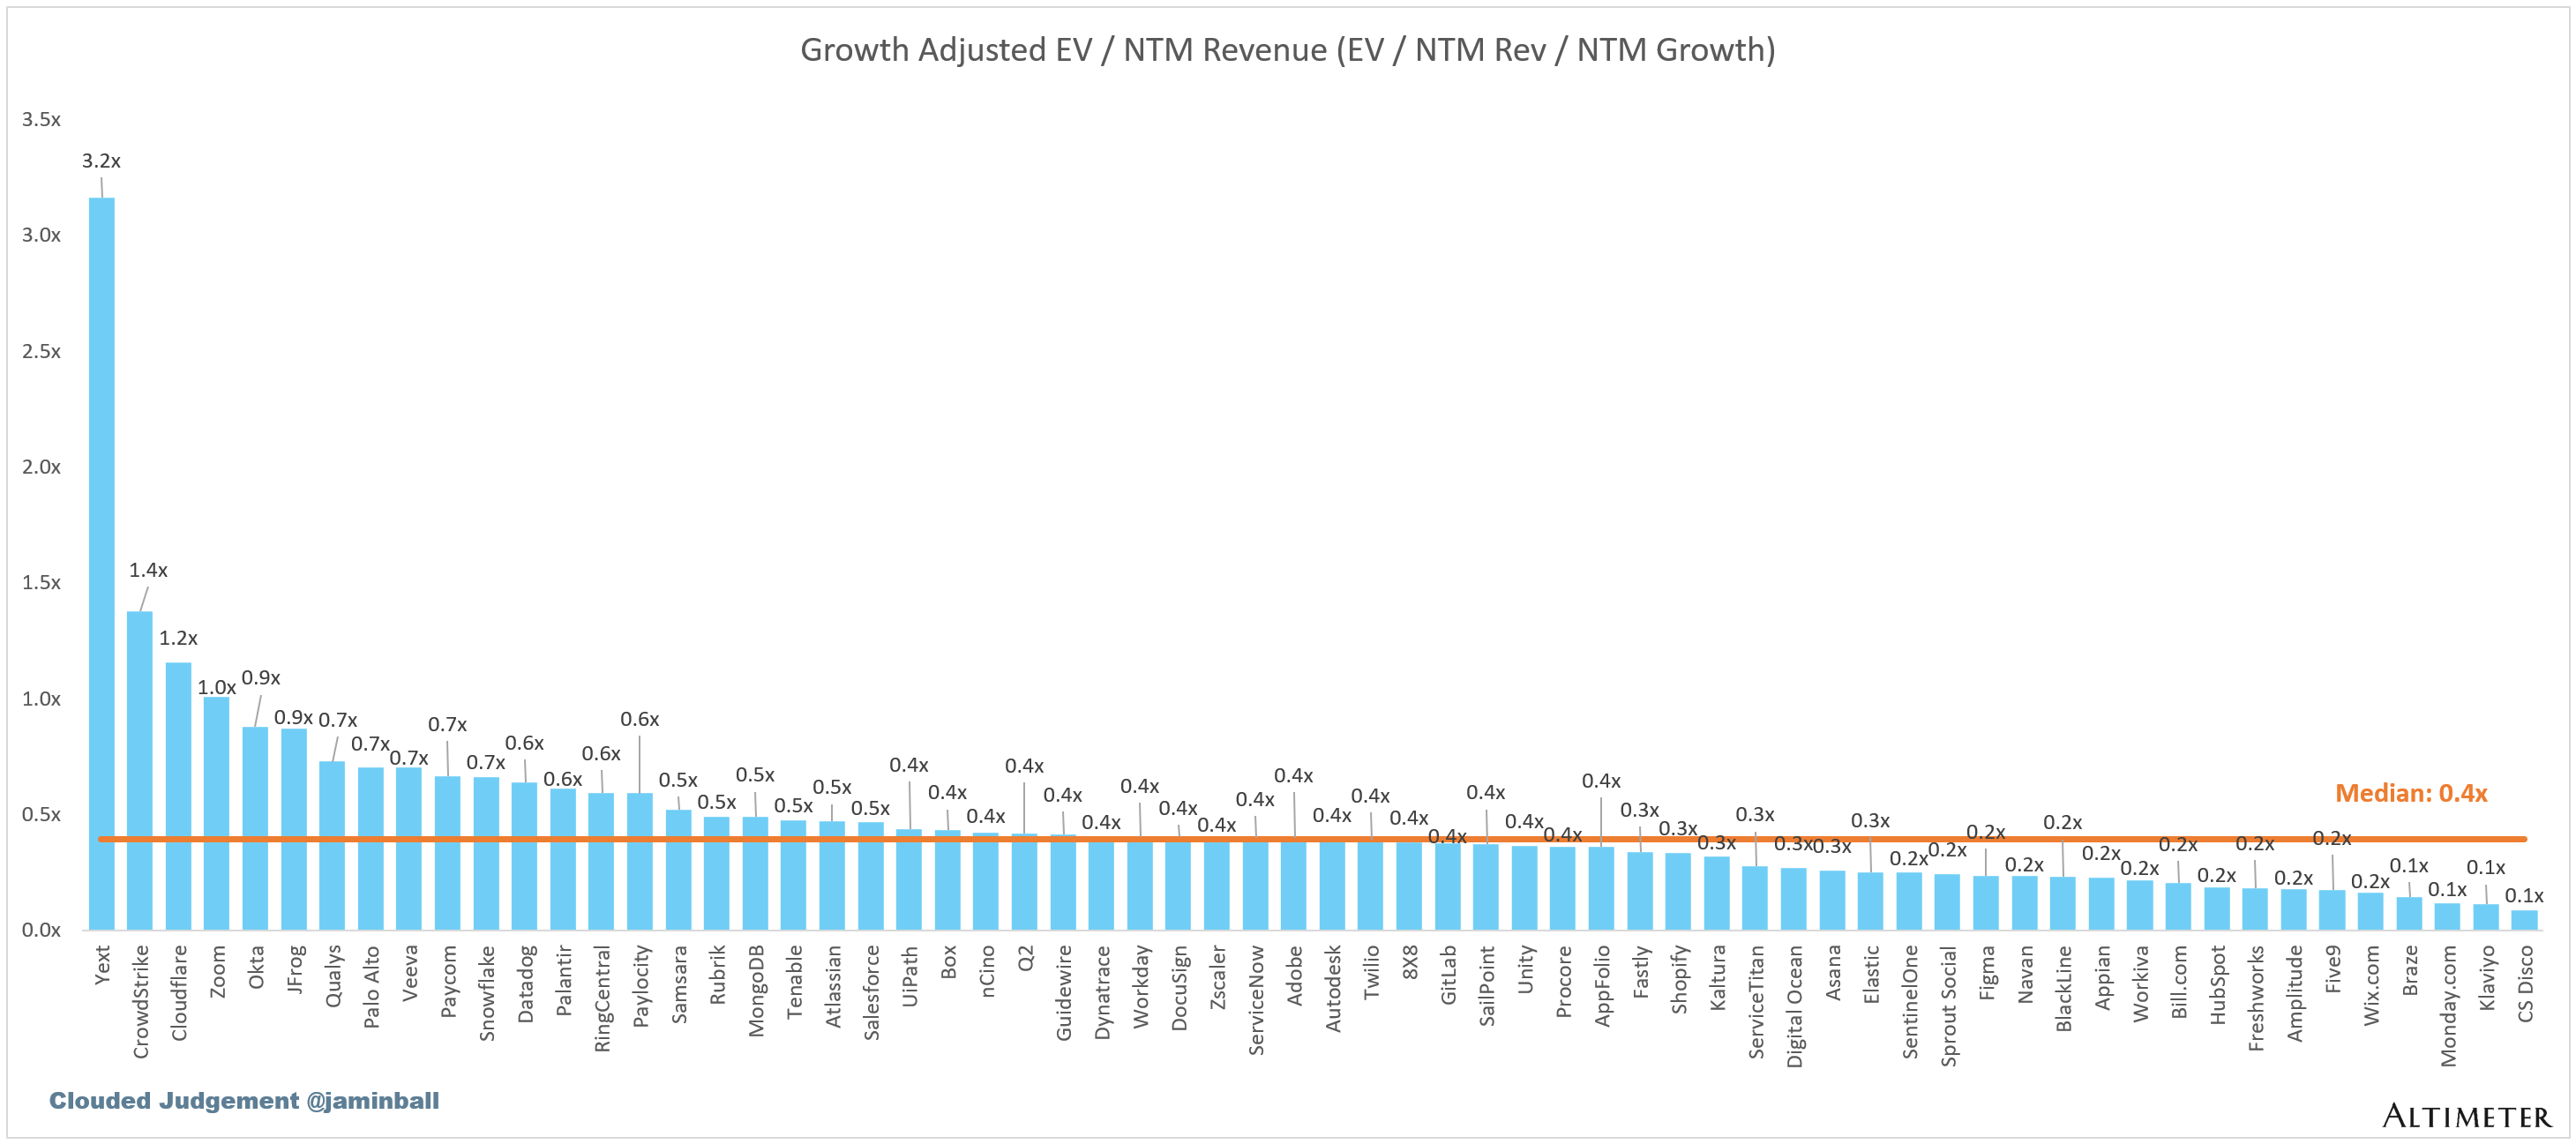
The below chart shows the EV / NTM revenue multiple divided by NTM consensus growth expectations. So a company trading at 20x NTM revenue that is projected to grow 100% would be trading at 0.2x. The goal of this graph is to show how relatively cheap / expensive each stock is relative to its growth expectations.
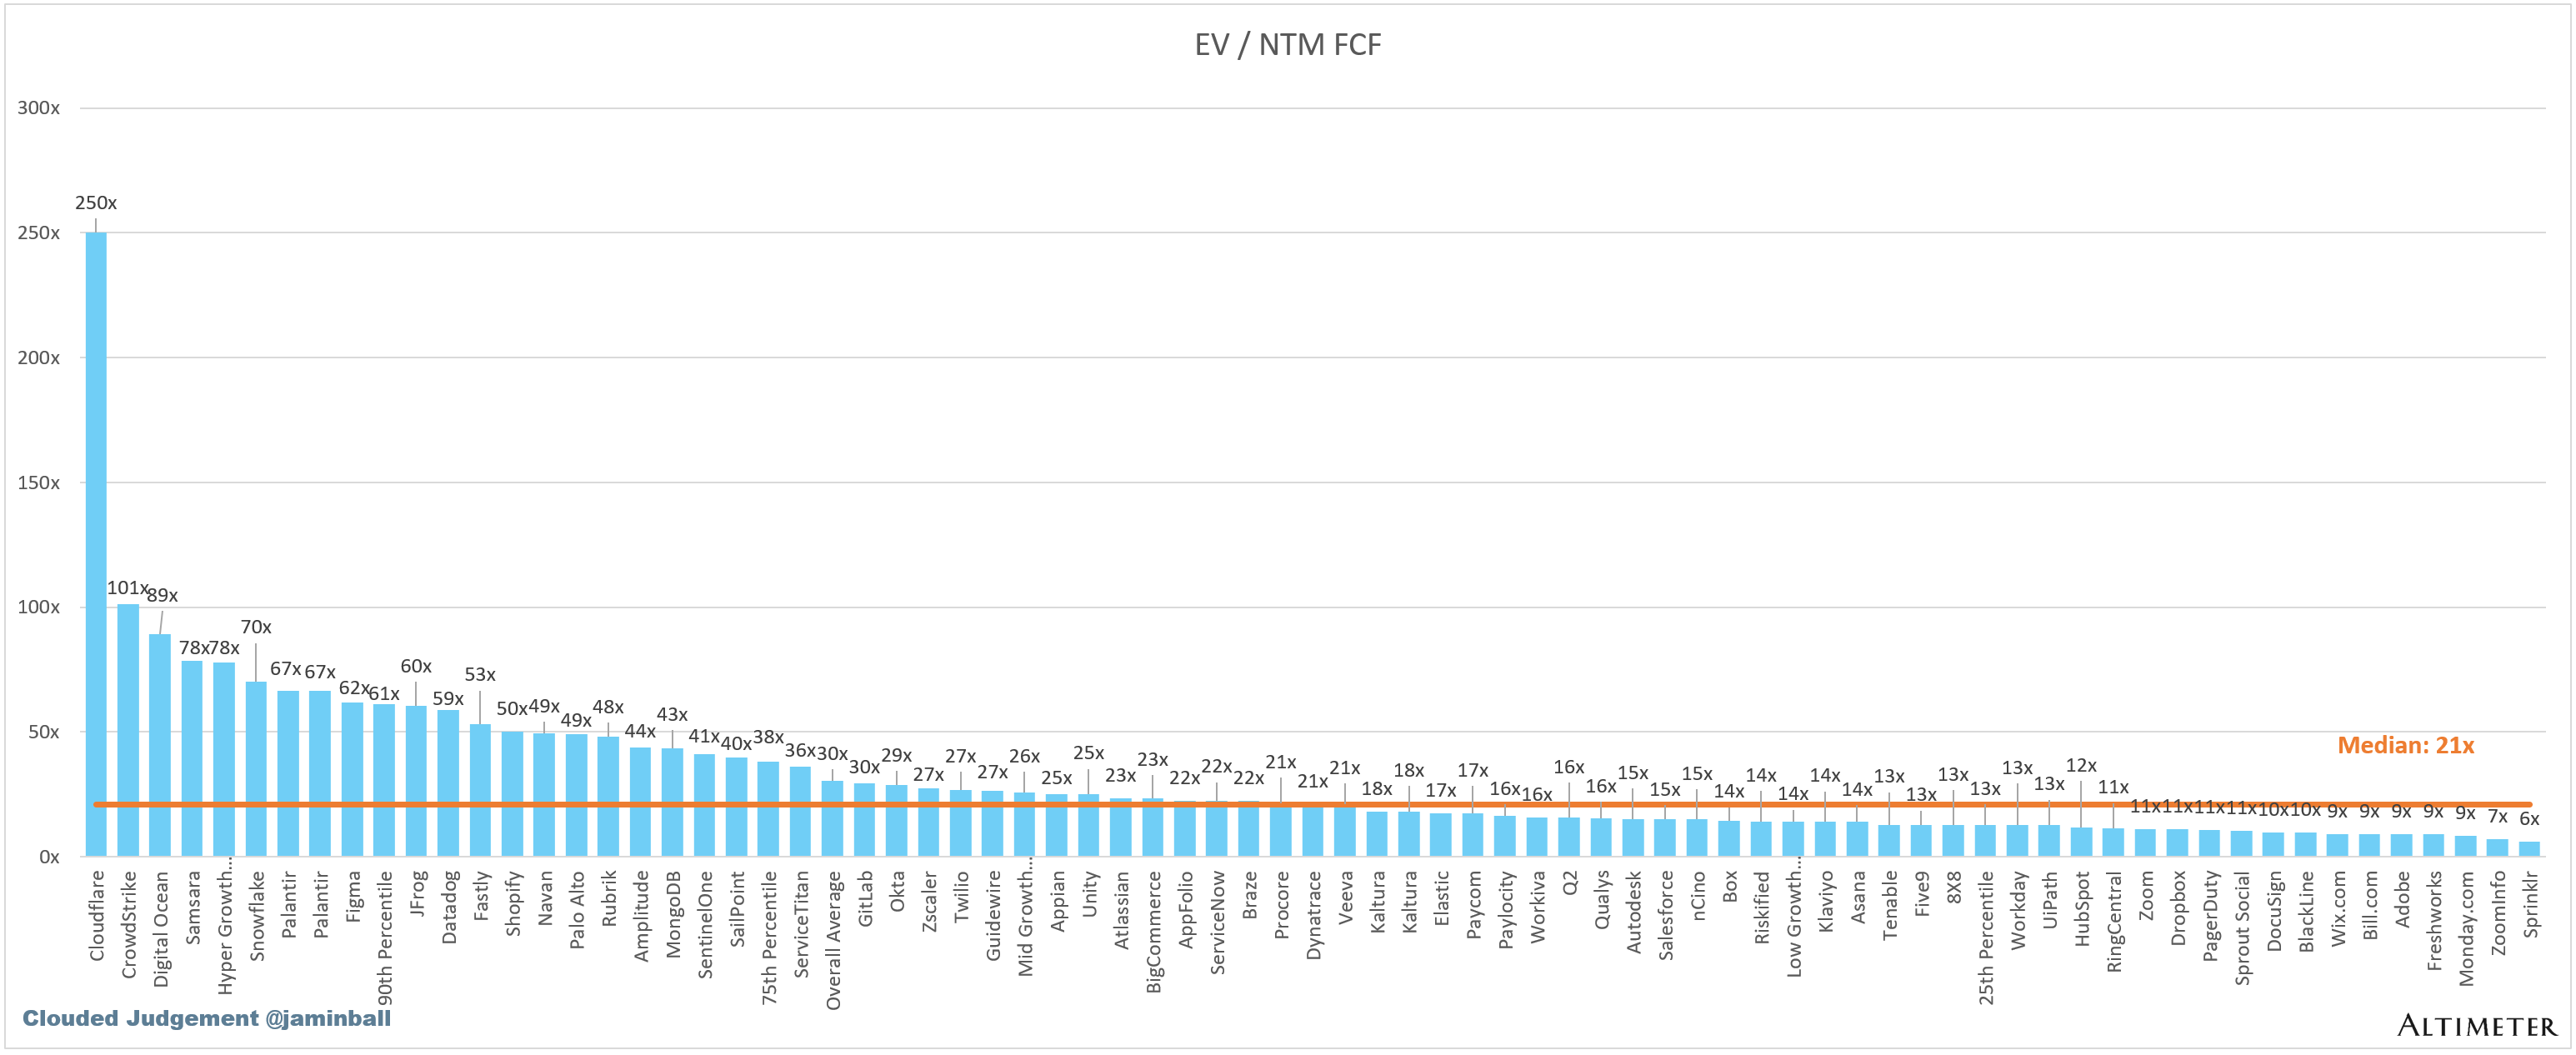
EV / NTM FCF
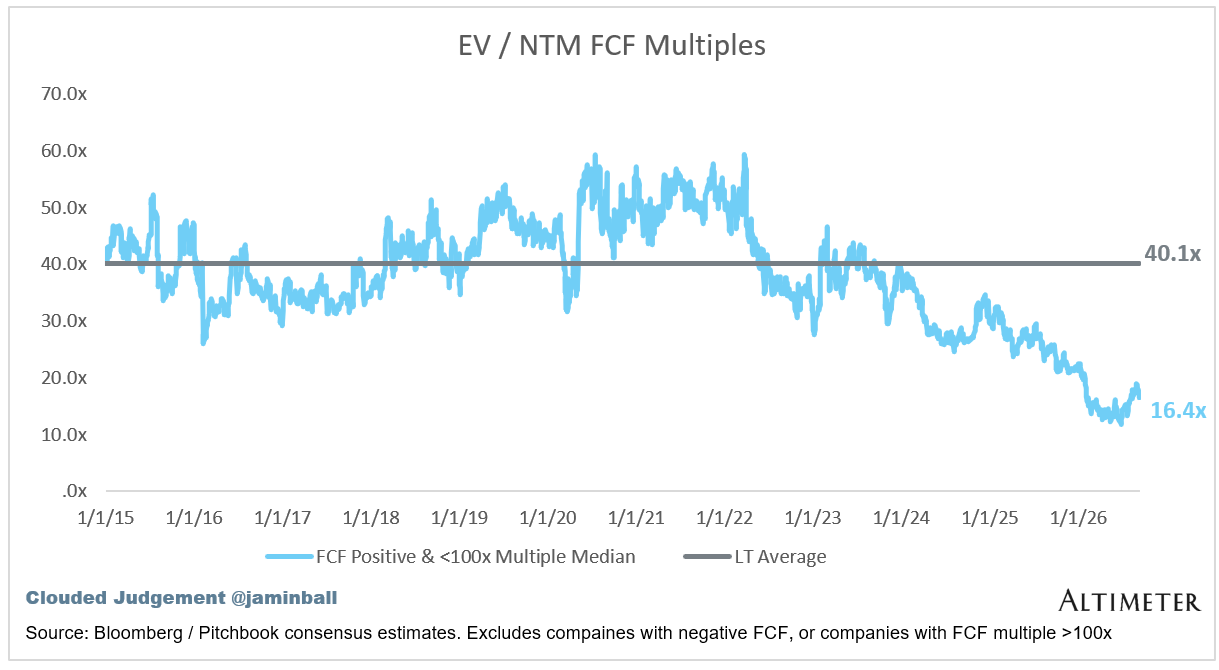
The line chart shows the median of all companies with a FCF multiple >0x and <100x. I created this subset to show companies where FCF is a relevant valuation metric.
Companies with negative NTM FCF are not listed on the chart
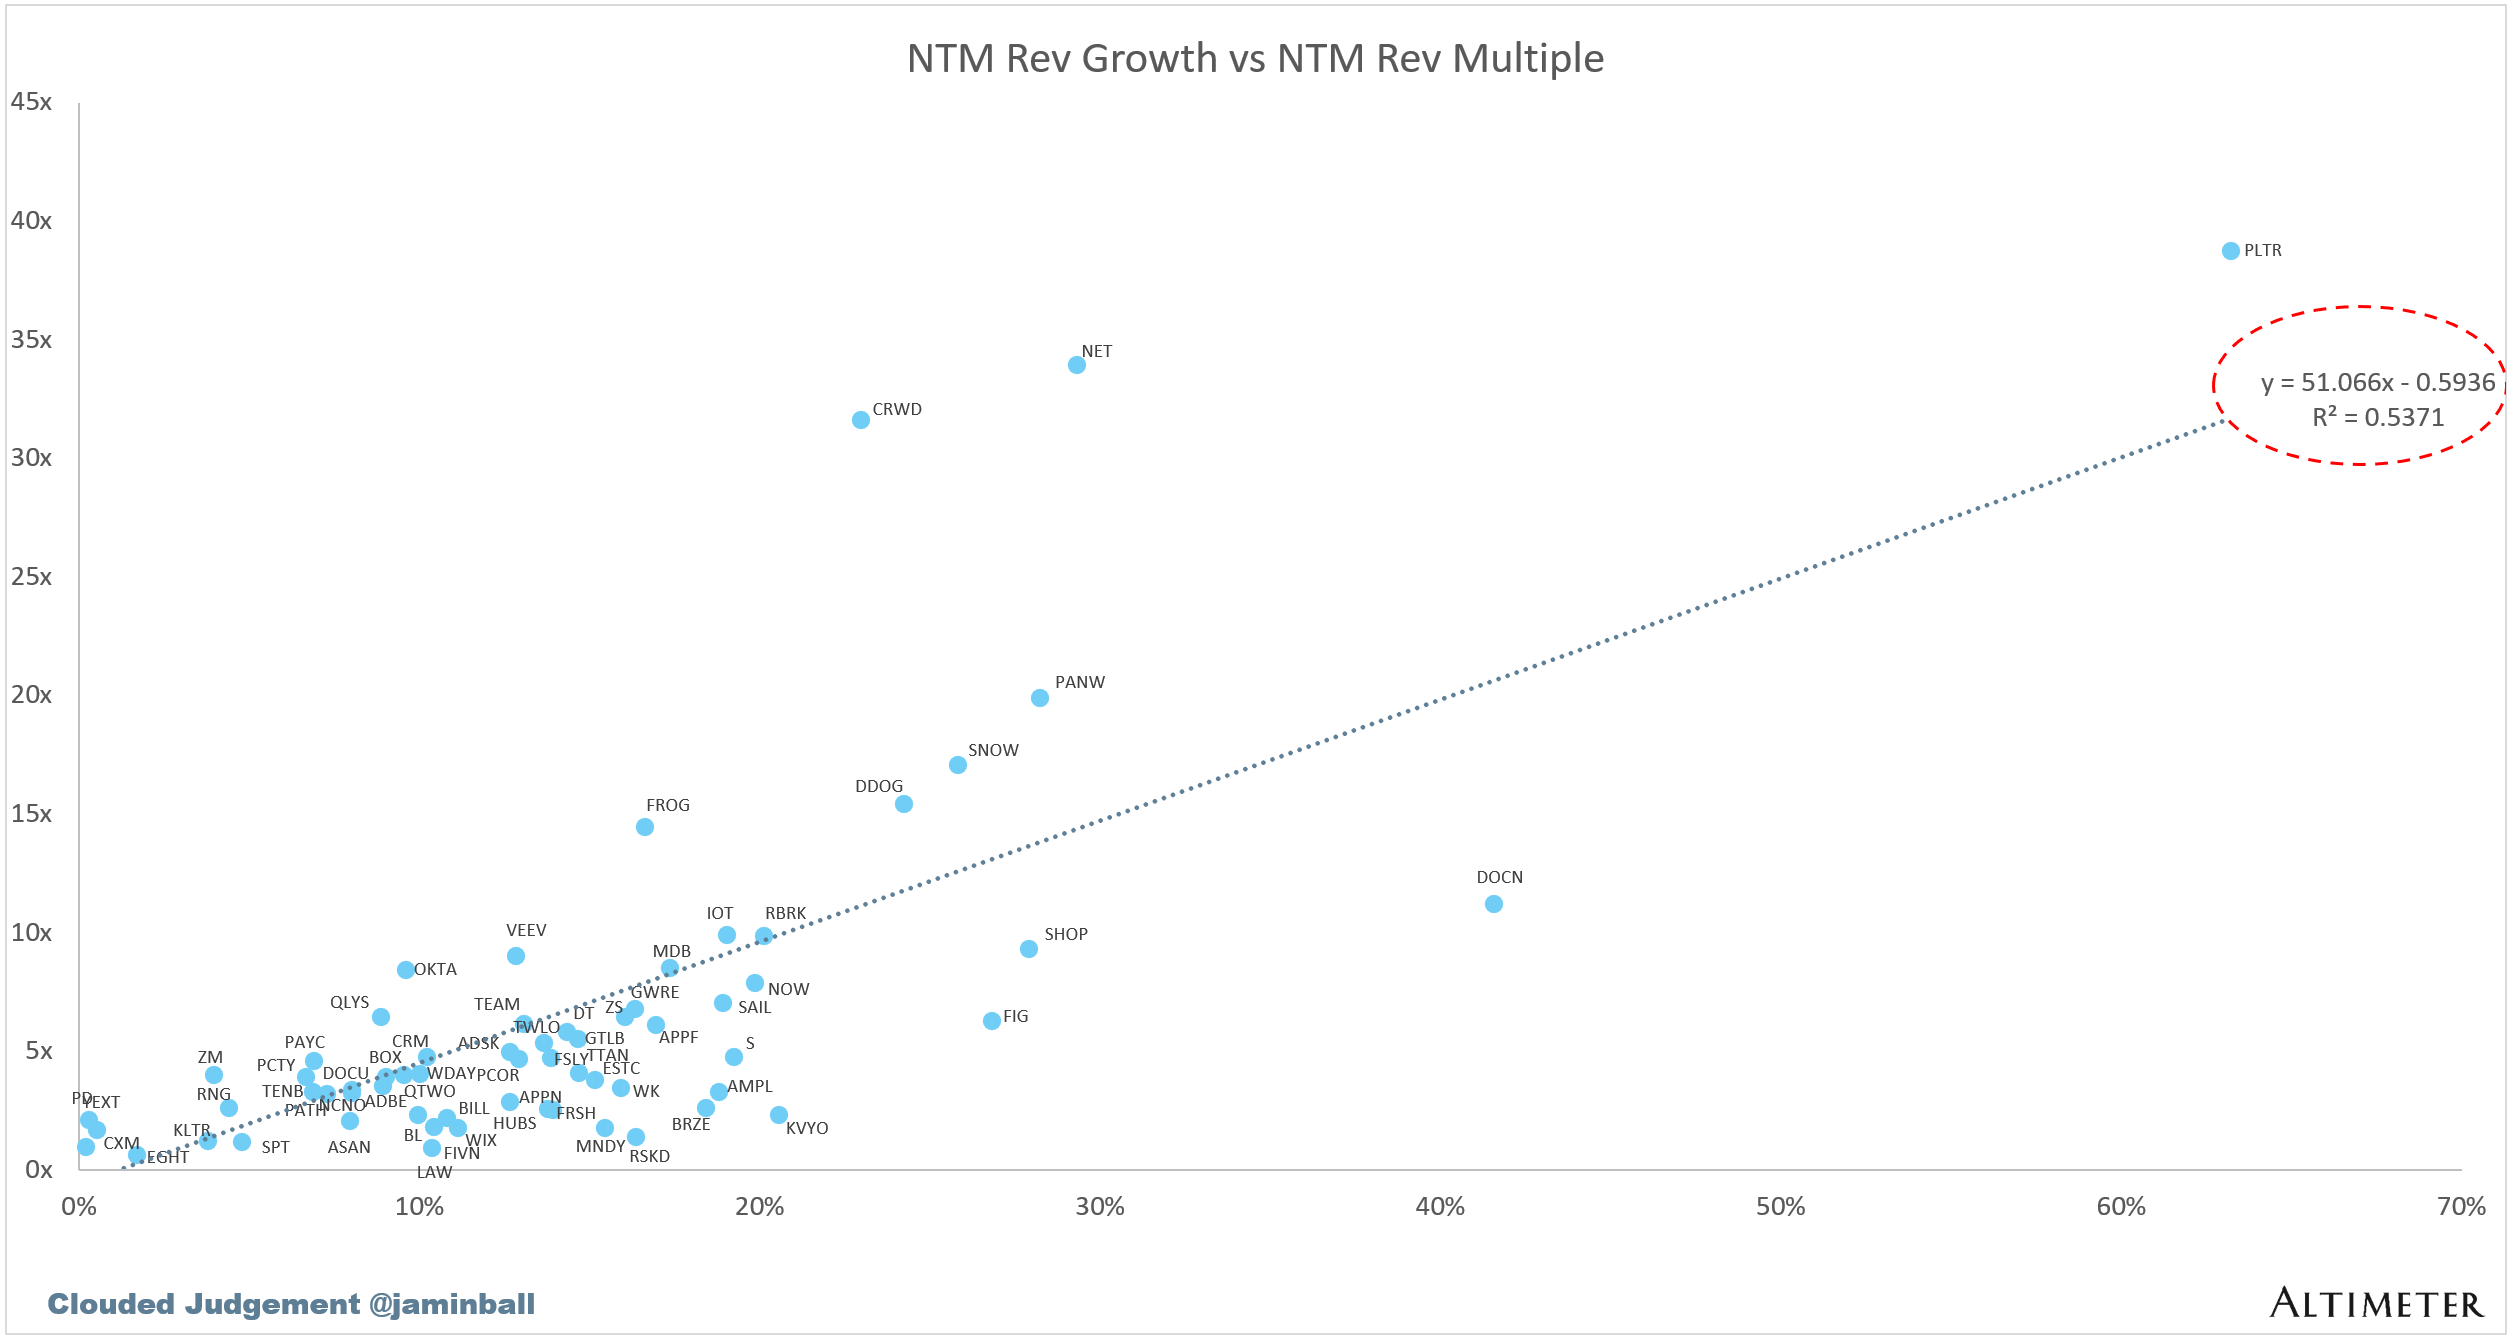
Scatter Plot of EV / NTM Rev Multiple vs NTM Rev Growth
How correlated is growth to valuation multiple?
Operating Metrics
Median NTM growth rate: 13%
Median LTM growth rate: 16%
Median Gross Margin: 76%
Median Operating Margin 2%
Median FCF Margin: 21%
Median Net Retention: 110%
Median CAC Payback: 44 months
Median S&M % Revenue: 34%
Median R&D % Revenue: 23%
Median G&A % Revenue: 13%
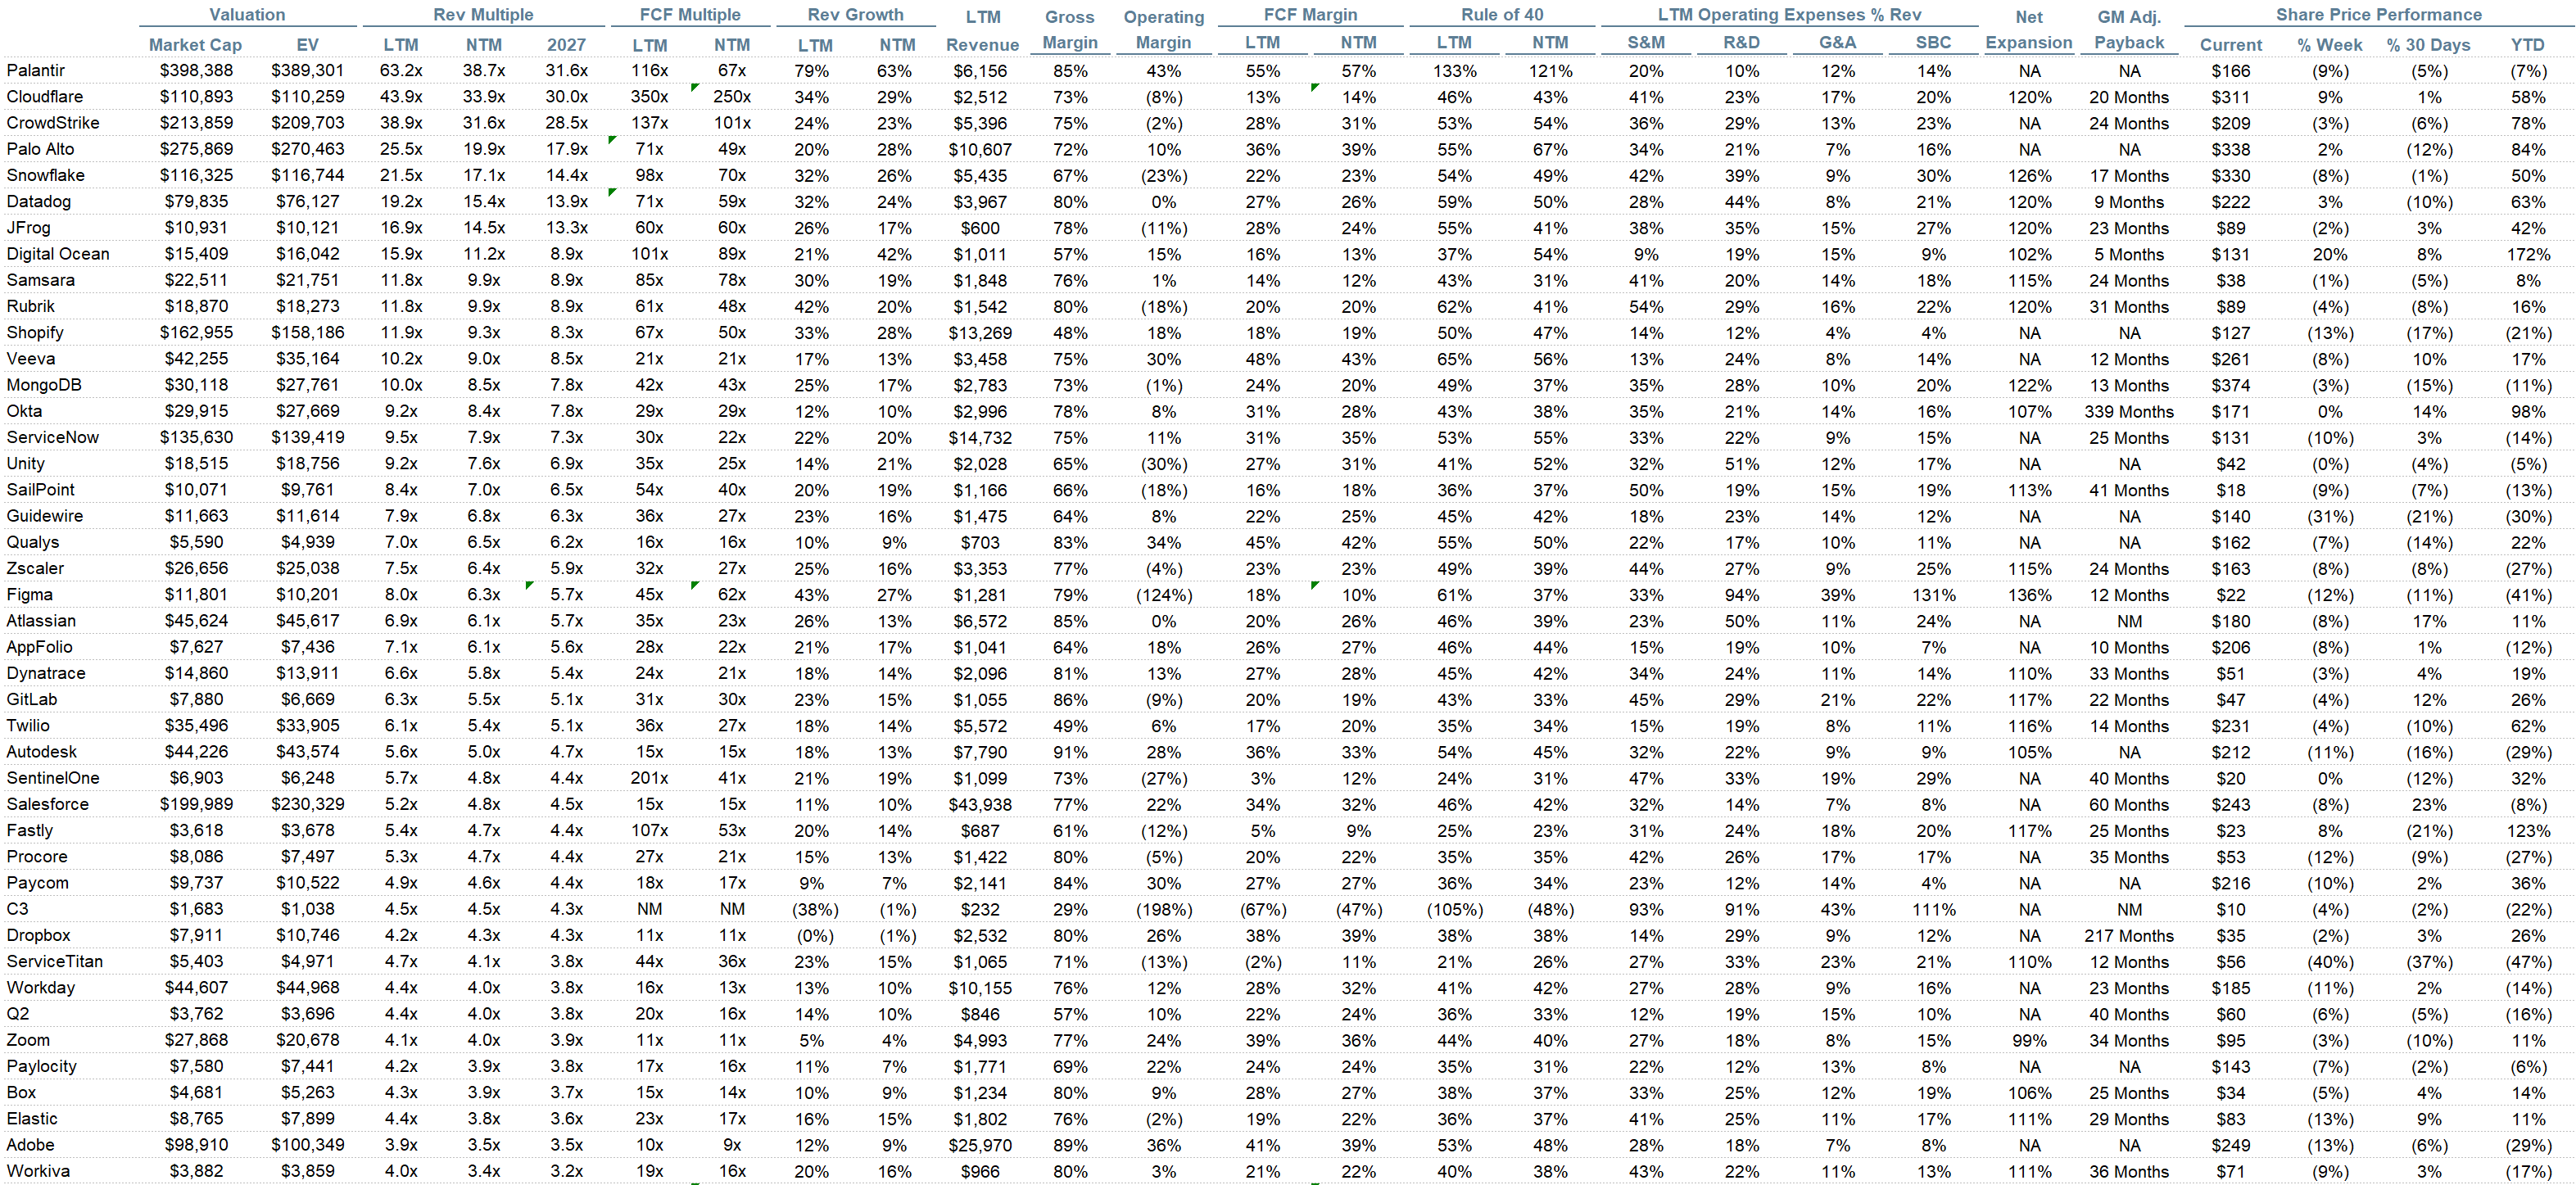
Comps Output
Rule of 40 shows rev growth + FCF margin (both LTM and NTM for growth + margins). FCF calculated as Cash Flow from Operations - Capital Expenditures
GM Adjusted Payback is calculated as: (Previous Q S&M) / (Net New ARR in Q x Gross Margin) x 12. It shows the number of months it takes for a SaaS business to pay back its fully burdened CAC on a gross profit basis. Most public companies don’t report net new ARR, so I’m taking an implied ARR metric (quarterly subscription revenue x 4). Net new ARR is simply the ARR of the current quarter, minus the ARR of the previous quarter. Companies that do not disclose subscription rev have been left out of the analysis and are listed as NA.
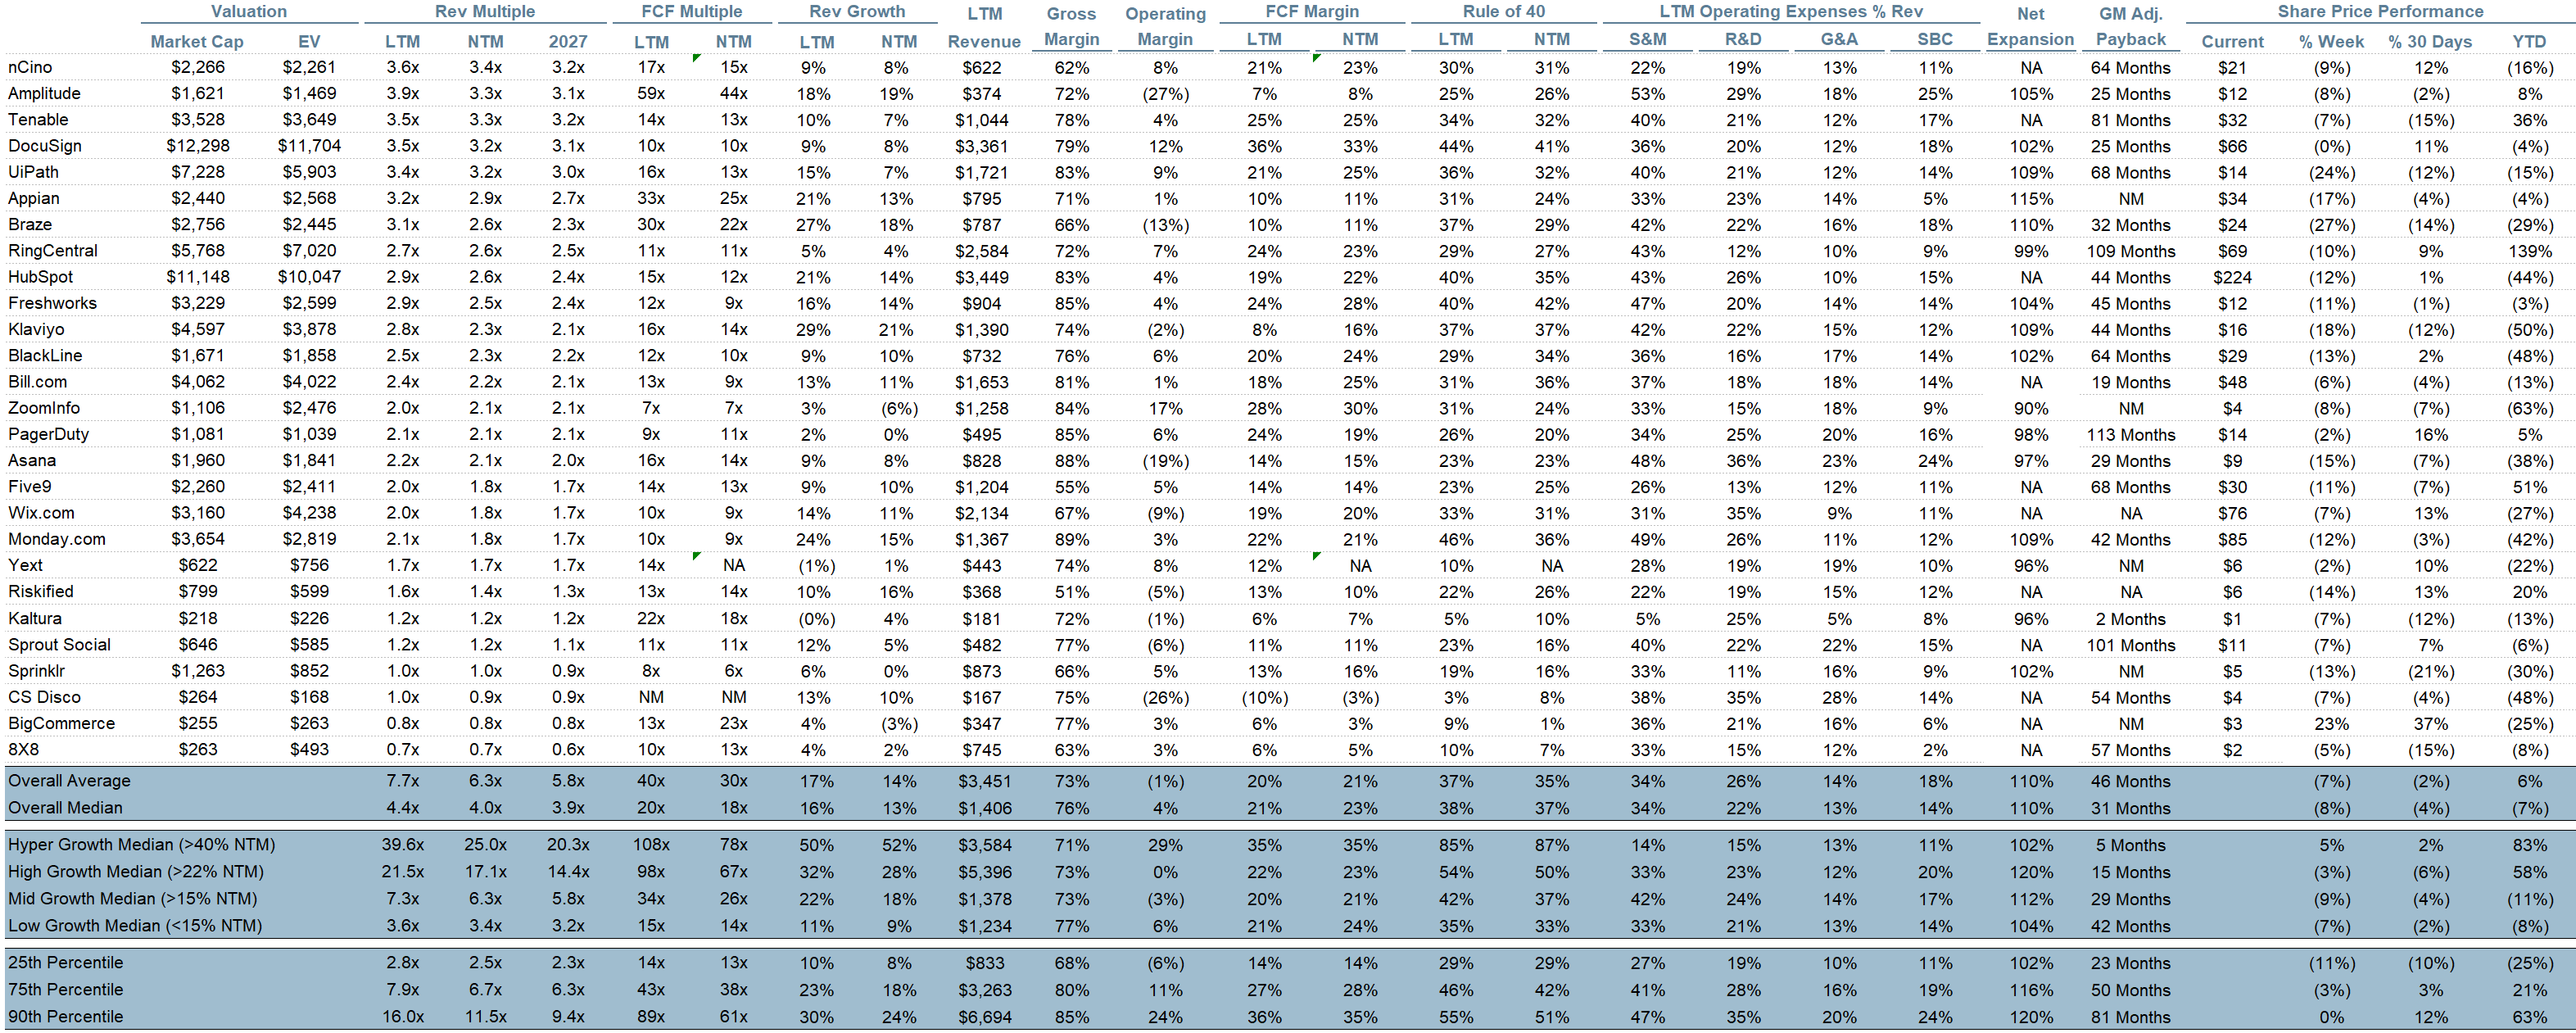
Sources used in this post include Bloomberg, Pitchbook and company filings
The information presented in this newsletter is the opinion of the author and does not necessarily reflect the view of any other person or entity, including Altimeter Capital Management, LP (”Altimeter”). The information provided is believed to be from reliable sources but no liability is accepted for any inaccuracies. This is for information purposes and should not be construed as an investment recommendation. Past performance is no guarantee of future performance. Altimeter is an investment adviser registered with the U.S. Securities and Exchange Commission. Registration does not imply a certain level of skill or training. Altimeter and its clients trade in public securities and have made and/or may make investments in or investment decisions relating to the companies referenced herein. The views expressed herein are those of the author and not of Altimeter or its clients, which reserve the right to make investment decisions or engage in trading activity that would be (or could be construed as) consistent and/or inconsistent with the views expressed herein.
This post and the information presented are intended for informational purposes only. The views expressed herein are the author’s alone and do not constitute an offer to sell, or a recommendation to purchase, or a solicitation of an offer to buy, any security, nor a recommendation for any investment product or service. While certain information contained herein has been obtained from sources believed to be reliable, neither the author nor any of his employers or their affiliates have independently verified this information, and its accuracy and completeness cannot be guaranteed. Accordingly, no representation or warranty, express or implied, is made as to, and no reliance should be placed on, the fairness, accuracy, timeliness or completeness of this information. The author and all employers and their affiliated persons assume no liability for this information and no obligation to update the information or analysis contained herein in the future.
Or, the spirit of Gordon Moore is alive and well
We need more effort and investment into explainability of the solutions and reasoning if we want these kinds of outcomes to be valuable. One of the greatest returns on these hard problems in Math is the generation of more problems and ideas that expand the frontier. If all we are left with is a slop answer and nothing else then we are missing the point and the value. I have been waiting a few years for AI to begin attacking the Maths and I hope that the people operating on the frontier take this more seriously.
I absolutely agree that if AI can provide a cure to cancer then we shouldn't feel bad about ruining someone's ego in order t get there. The problem is that in an effort to move fast, the frontier labs are focusing on resulting rather than the process itself. We will lose something.
I will use an example. In an effort to find a cure for AIDs, the NIH committed an enormous amount of capital to solve the problem. In the 45 years since the virus was first characterized we have made it into a treatable chronic disease - absolutely amazing. What is not often talked about is that in order to get there we ended up uncovering the many mysteries of the human immune system which in the early 80s we knew almost nothing about. That was huge and has served as the foundation of a lot research and terrific outcomes unrelated to HIV/AIDS.
One hypothesis I hold is that the universe of Math is much like the universe itself, it curves in on itself and that seemingly disconnected disciplines and concepts are actually more closely related than we think. One of the beauties of math and theoretical physics as an extension is that theory moves faster than our ability to experiment and confirm. AI may help us to confirm, but it also has the potential to help us open new frontiers and discover new applications of what we thought was just a thought experiment. Just look at Number Theory, Representation theory and Category Theory. They are abstract, but it turns they may have very useful applications.
My concern is that in a rush to create nice headlines for the IPO, we are losing the point.
On the cost part just look at the cost curve for sequencing the human genome. I believe it started near $100m and is now $300 or so. The deflationary force of technology is mind-boggling and opens up opportunities we can not imagine.