Every week I’ll provide updates on the latest trends in cloud software companies. Follow along to stay up to date!
Software Setup
Currently, interest rates seem to be the primary driver of software valuations. We just wrapped up Q2 earnings season, and are a couple months away from getting incremental data on individual company performances (Q3 earnings season). So until we get that data, we’ll see short term moves more tied to rates. Let’s put aside the short term, and think about what the drivers will be of software valuations over the next couple quarters into the first half of 2024. I think it boils down to two main questions that are tied together:
1. Will growth re-accelerate in Q3 or Q4?
2. Are 2024 estimates too high? Too low? Just right?
I’m taking for granted that over the next 5 quarters my view is rates will have a muted impact on valuations. I don’t think we see any big surprises in either direction. If anything, the big surprise could be rates much lower because we’ve entered a recession, but in that scenario it’s more clear what happens to software valuations…
On question 1 – Q3 was the quarter everyone expected to see some re-acceleration. And I think we got some hints in Q2 that re-acceleration may be a quarter or two. AWS growth seems to be re-accelerating, and qualitative feedback from a number of companies in Q2 (especially those with July quarter ends) suggested new customer bookings conversations were picking up. We also saw net new ARR pick up in Q2. There’s two components to look at when evaluation acceleration – there’s the YoY comparison from Q3 vs Q2, and then there’s the QoQ comparison (I like to look at net new ARR added trends). Given Q3 ’22 was the first quarter macro headwinds really started to kick in, in Q3 ’23 we may see “mathematically” re-acceleration due to the comparison of a year ago period being a depressed quarter (vs in Q2 ’23 the current quarter was a depressed quarter, but the year ago quarter was not). This type of “re-acceleration” isn’t that interesting. The QoQ, or change in net new ARR is more appropriate.
On Question 2 – this is the big one. Are 2024 estimates correct, and what level of re-acceleration is baked in? Right now – there is a level of re-acceleration baked in to 2024 estimates. The graph below shows the difference between 2024 consensus growth rates and 2023 consensus growth rates (so 2024 growth minus 2023 growth). The companies with positive numbers have acceleration baked into consensus estimates. Normally we’d expect growth to decay from one year to the next at about 80%. So if a company grew 50% this year, we’d expect them to grow 40% the following year. What the data shows below - consensus estimates are currently baking in NO growth decay for the overall software universe, and 48% of companies are expected to accelerate
Why might 2024 estimates be wrong? A) we hit a recession and all numbers are slashed. B) Acceleration does happen, but it takes longer than we think (ie 2024 numbers too high). Or C) Acceleration happens faster than we hink and numbers are too low. In general, as long as we see stable-ish rates, stocks go up when numbers go up, and fall when numbers fall. So taking a point of view on which companies have too much or too little acceleration baked in can provide an opportunity. Looking at how consensus estimates change will be more of a lagging than leading indicator. I’ll start to show quarterly how 2024 estimates are changing, but this will be more of an “explanation” for a change in stock price vs a prediction of what’s to come. For now, the chart below shows how 2024 estimates changed after Q3 earnings. As you can see, for the most part 2024 estimates stayed constant. For the bottom 10 companies on the right hand side of the chart, the median change in stock price after earnings was (18%). As you can see, when numbers go down, stocks go down…
Quarterly Reports Summary
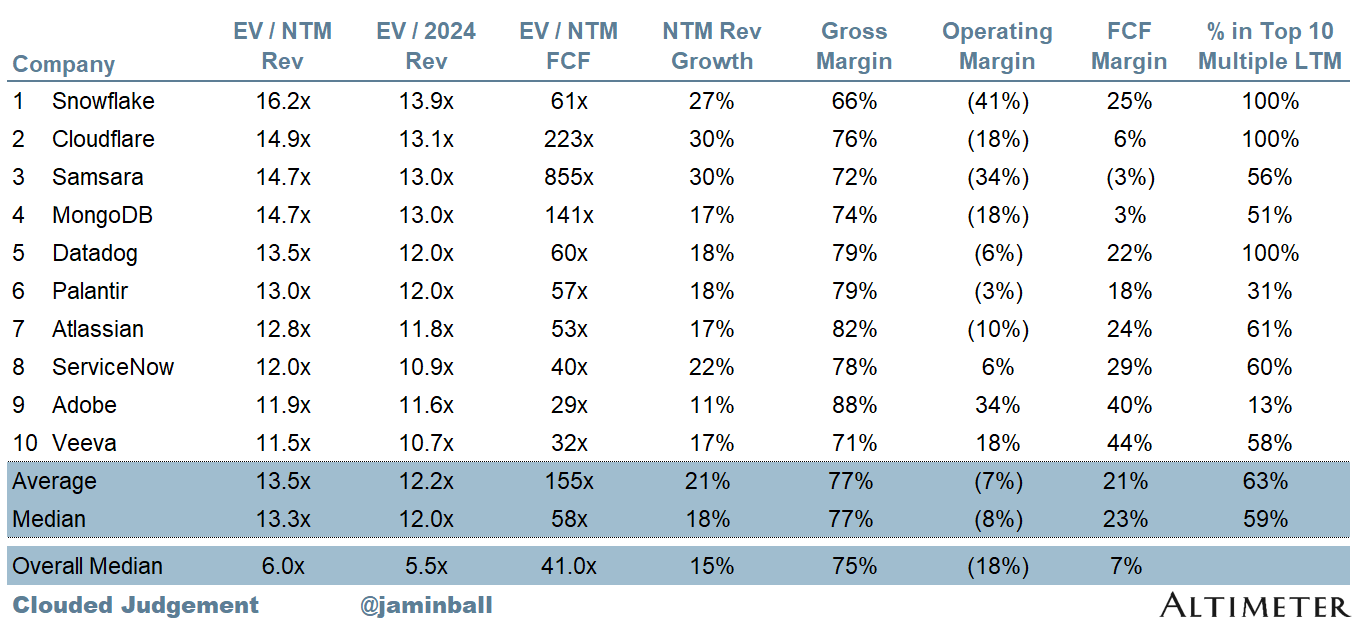
Top 10 EV / NTM Revenue Multiples
Top 10 Weekly Share Price Movement
Update on Multiples
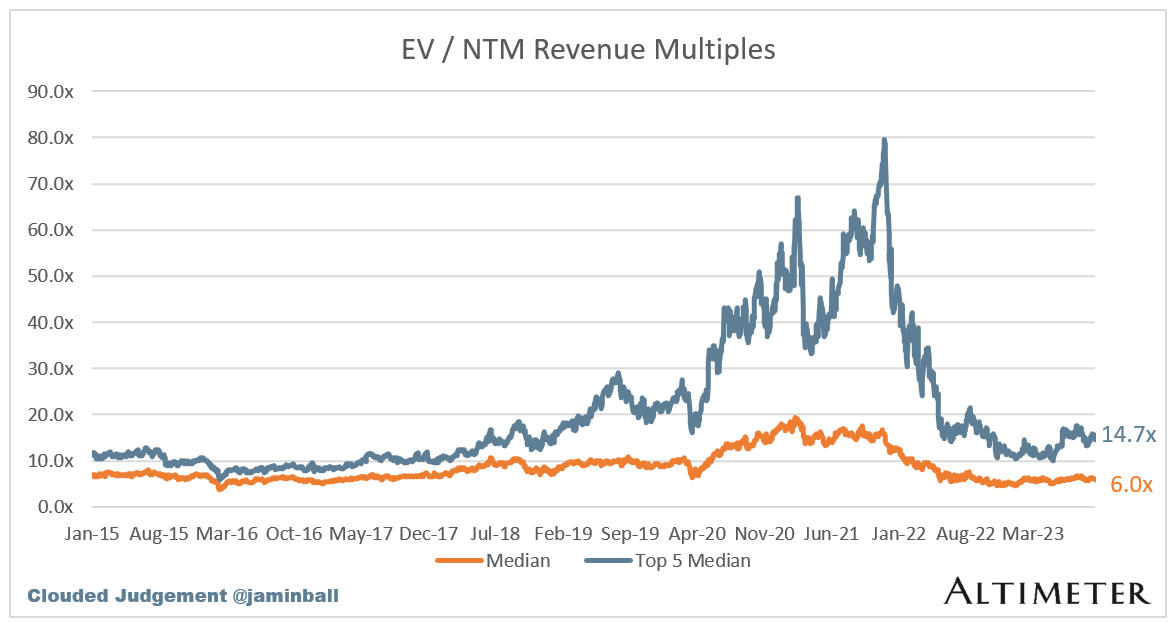
SaaS businesses are generally valued on a multiple of their revenue - in most cases the projected revenue for the next 12 months. Revenue multiples are a shorthand valuation framework. Given most software companies are not profitable, or not generating meaningful FCF, it’s the only metric to compare the entire industry against. Even a DCF is riddled with long term assumptions. The promise of SaaS is that growth in the early years leads to profits in the mature years. Multiples shown below are calculated by taking the Enterprise Value (market cap + debt - cash) / NTM revenue.
Overall Stats:
Overall Median: 6.0x
Top 5 Median: 14.7x
10Y: 4.3%
Bucketed by Growth. In the buckets below I consider high growth >30% projected NTM growth, mid growth 15%-30% and low growth <15%
High Growth Median: 12.9x
Mid Growth Median: 8.6x
Low Growth Median: 3.9x
EV / NTM Rev / NTM Growth
The below chart shows the EV / NTM revenue multiple divided by NTM consensus growth expectations. So a company trading at 20x NTM revenue that is projected to grow 100% would be trading at 0.2x. The goal of this graph is to show how relatively cheap / expensive each stock is relative to their growth expectations
EV / NTM FCF
The line chart shows the median of all companies with a FCF multiple >0x and <100x. I created this subset to show companies where FCF is a relevant valuation metric.
Companies with negative NTM FCF are not listed on the chart
Scatter Plot of EV / NTM Rev Multiple vs NTM Rev Growth
How correlated is growth to valuation multiple?
Operating Metrics
Median NTM growth rate: 15%
Median LTM growth rate: 21%
Median Gross Margin: 75%
Median Operating Margin (18%)
Median FCF Margin: 7%
Median Net Retention: 114%
Median CAC Payback: 35 months
Median S&M % Revenue: 42%
Median R&D % Revenue: 27%
Median G&A % Revenue: 16%
Comps Output
Rule of 40 shows rev growth + FCF margin (both LTM and NTM for growth + margins). FCF calculated as Cash Flow from Operations - Capital Expenditures
GM Adjusted Payback is calculated as: (Previous Q S&M) / (Net New ARR in Q x Gross Margin) x 12 . It shows the number of months it takes for a SaaS business to payback their fully burdened CAC on a gross profit basis. Most public companies don’t report net new ARR, so I’m taking an implied ARR metric (quarterly subscription revenue x 4). Net new ARR is simply the ARR of the current quarter, minus the ARR of the previous quarter. Companies that do not disclose subscription rev have been left out of the analysis and are listed as NA.
Sources used in this post include Bloomberg, Pitchbook and company filings
The information presented in this newsletter is the opinion of the author and does not necessarily reflect the view of any other person or entity, including Altimeter Capital Management, LP ("Altimeter"). The information provided is believed to be from reliable sources but no liability is accepted for any inaccuracies. This is for information purposes and should not be construed as an investment recommendation. Past performance is no guarantee of future performance. Altimeter is an investment adviser registered with the U.S. Securities and Exchange Commission. Registration does not imply a certain level of skill or training.


I have more of a question than a comment. Would the small cap (say less than $5B) SaaS companies have the bandwidth with respect to the expertise and the budget to implement AI in their products?
@Jamin in your Top 10 EV / NTM Revenue Multiples table, is the delta between negative Operating Margin and positive FCF Margin mostly SBC?