
Clouded Judgement 9.19.25 - The AI Shift: Static Software vs. Living AI Systems

Every week I’ll provide updates on the latest trends in cloud software companies. Follow along to stay up to date!
The Shift: Static Software vs. Living AI Systems
In the world of traditional software, products were built on determinism. You shipped a feature, QA tested it, and expected it to behave the same way tomorrow as it did yesterday. Releases were milestones (that admitedly have seen the time between them drastically fall over the years as software is shipped daily or multiple times a day). But regardless, once something was stable, it generally stayed that way.
AI breaks this assumption. AI products now look more like living systems vs static ones.
Models drift as data changes. AI providers push new models that improve performance on average but can regress in specific cases. Or, the updated model just “feels” different and users don’t like it (kind of similar to when Facebook back in the day would update the UI of the newsfeed, and people would hate it). Feedback loops subtly alter behavior as users interact. And probabilistic outputs mean no two runs are guaranteed to look alike.
For founders, this creates a new reality. Versioning is no longer straightforward, you can’t just swap in GPT-X+1 and call it an upgrade. It requires compatibility checks, regression testing, and often a rollback plan. Customers notice inconsistencies immediately, and even when accuracy improves on paper, a product that feels less reliable in practice can erode trust. Observability becomes critical not only for internal teams but also for delivering a consistent user experience. And as a byproduct, support teams face an entirely new category of tickets: “this worked yesterday but not today.”
My takeaway is that AI products have to be managed with a different playbook. You need to build for adaptability assuming change is the norm (vs the exception). That means architecting systems so you can hot-swap models, prompts, and workflows without breaking downstream behavior. This becomes even more important as I’d imagine the model providers would prefer to build lock-in around their models to reduce customers ability to “hot swap.”
Evaluation also has to become continuous, more like unit testing than periodic QA, with clear signals on whether changes are helping or hurting (or how it changes the end user experience). I really think just about every AI Agent company will need to have observability (and dashboards that power observability for end customers) baked in to the core product. Side note - we’ll also need databases to manage all of these observability metrics to power the observability products and dashboards (and theses agents will spit off orders of magnitude more metrics), which is part of the reason I get so excited about ClickHouse’s potential to become the database for AI.
Rollouts should be gradual and controlled, closer to feature flags than wholesale releases, with the ability to roll back quickly. And above all, companies need to communicate openly with customers about why their products evolve. Framing change as part of an ongoing improvement cycle, something that makes the system smarter and more useful over time, can turn what feels like instability into a strength.
The companies that win won’t just be the ones with the best raw model. They’ll be the ones that manage the living system well - balancing adaptability with trust, and building infrastructure to guide products that evolve in real time. In other words, founders should stop thinking of AI apps as static SaaS and start thinking more like operators of dynamic systems. Biotech companies, financial markets, and logistics networks have been forced to manage this kind of complexity for decades. Now it’s software’s turn.
As an investor, here’s how I’m thinking about it. I’m less focused on who has the flashiest demo today and more interested in which teams are building the muscles to manage AI as a living system. The winners will be the ones who treat drift, versioning, and probabilistic behavior as first-class problems to solve (vs an afterthought). I look for founders who have built infrastructure for continuous evaluation, who roll out model changes with the same rigor as production code, and who communicate openly with customers about how and why their product evolves. These companies may not move the fastest in the short term, but over time they’re the ones that will earn trust, retain customers, and compound into durable businesses.
Growing M&A Landscape
We’re starting to see more and more M&A in the $500m - $3b range.
Workday bought Sana for $1.1b
Atlassian bought DX for $1b
Clio bought vLex for $1b
Databricks bought Neon for $1b
And this is on top of a number of other acquisitions earlier in the year (like ServiceNow acquiring Moveworks for ~$3b). It wouldn’t surprise me if we saw a rush of software acquisitions by incumbents in that $500m - $3b range as they look to bolt on modern, AI native solutions, or solutions that offer a data advantage for a broader AI strategy.
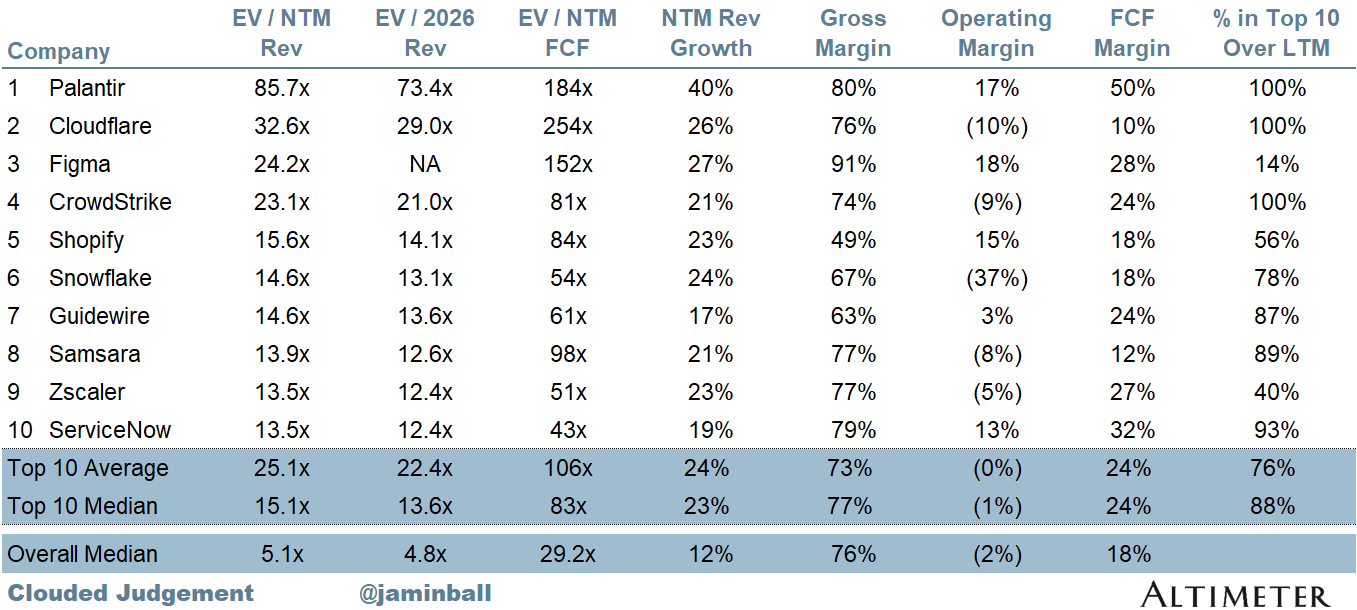
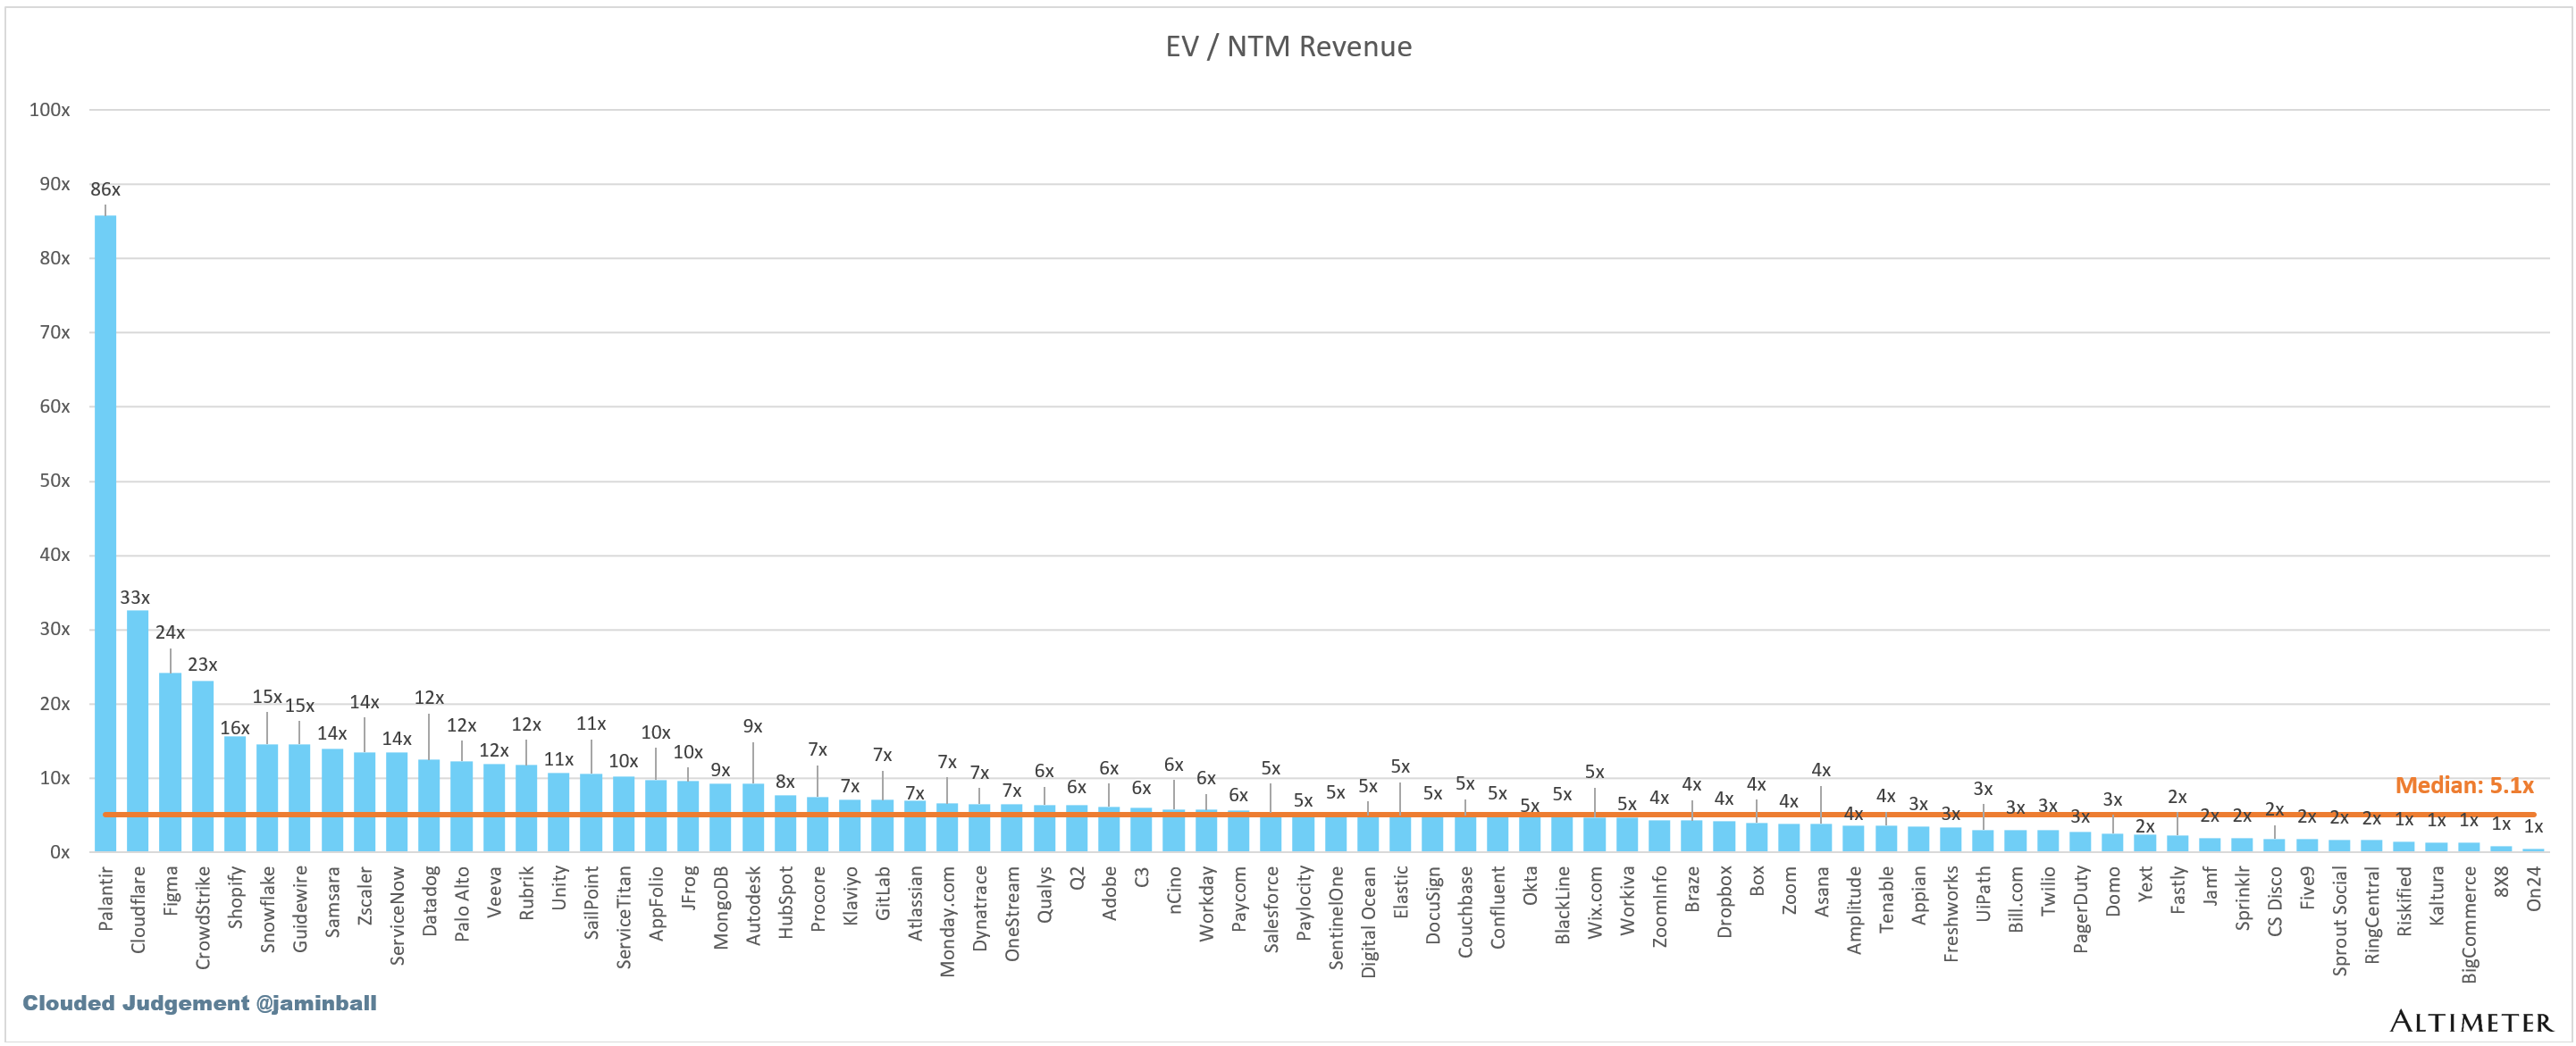
Top 10 EV / NTM Revenue Multiples
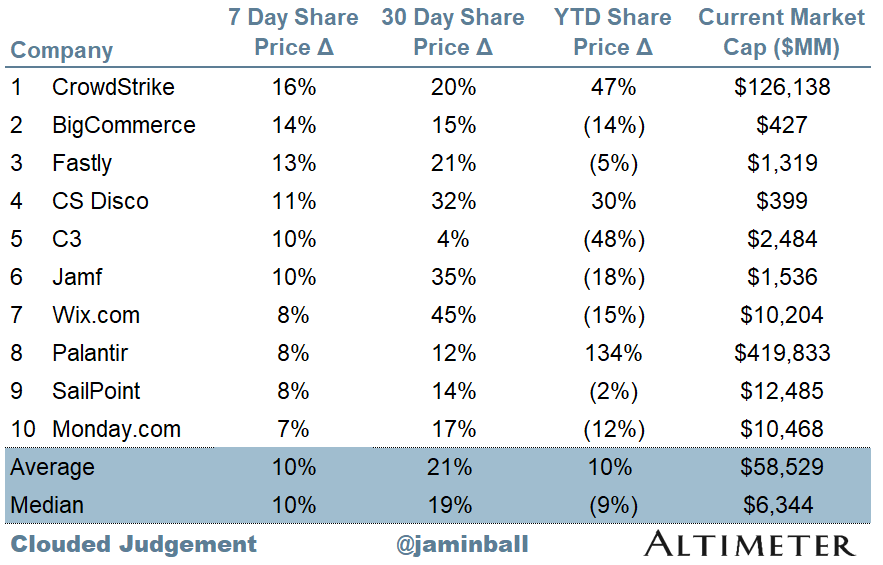
Top 10 Weekly Share Price Movement
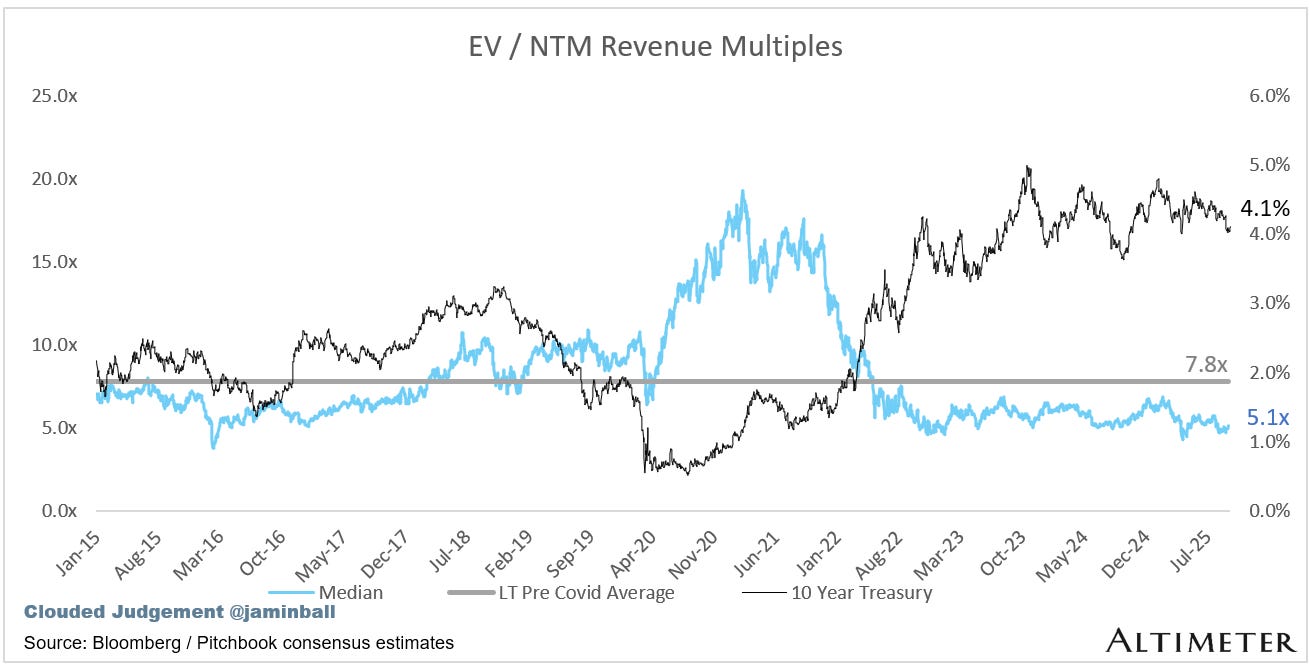
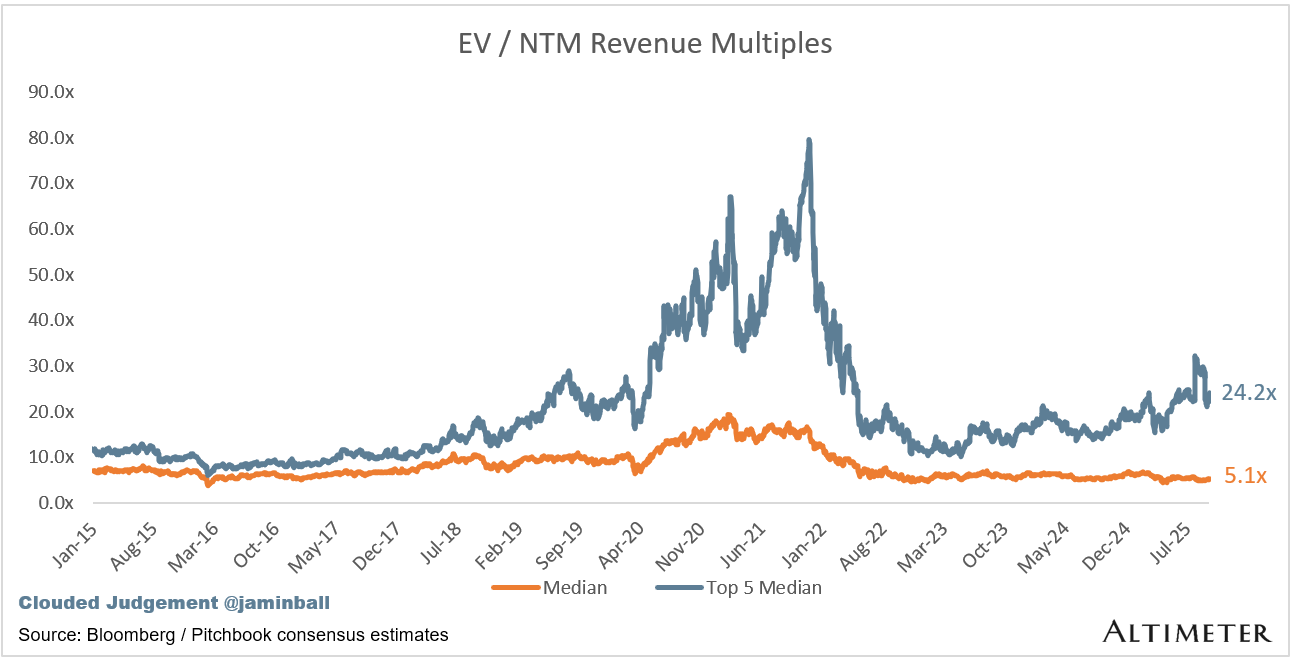
Update on Multiples
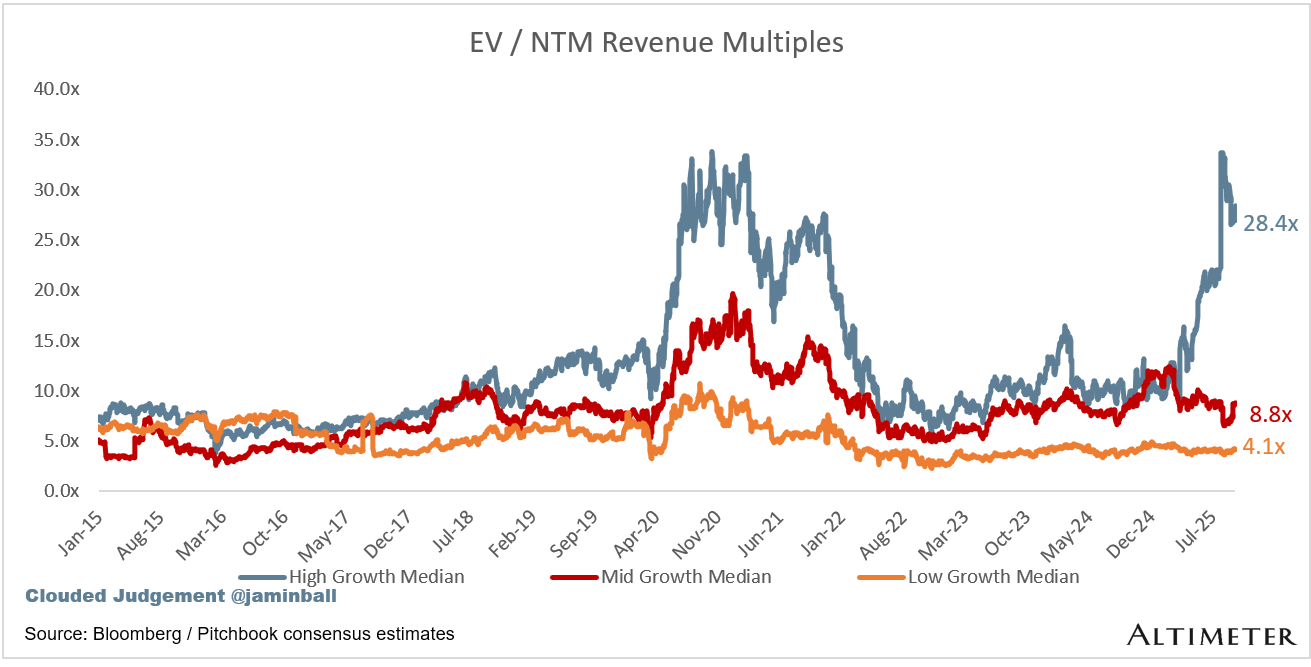
SaaS businesses are generally valued on a multiple of their revenue - in most cases the projected revenue for the next 12 months. Revenue multiples are a shorthand valuation framework. Given most software companies are not profitable, or not generating meaningful FCF, it’s the only metric to compare the entire industry against. Even a DCF is riddled with long term assumptions. The promise of SaaS is that growth in the early years leads to profits in the mature years. Multiples shown below are calculated by taking the Enterprise Value (market cap + debt - cash) / NTM revenue.
Overall Stats:
Overall Median: 5.1x
Top 5 Median: 24.2x
10Y: 4.1%
Bucketed by Growth. In the buckets below I consider high growth >25% projected NTM growth, mid growth 15%-25% and low growth <15%
High Growth Median: 28.4x
Mid Growth Median: 8.8x
Low Growth Median: 4.1x
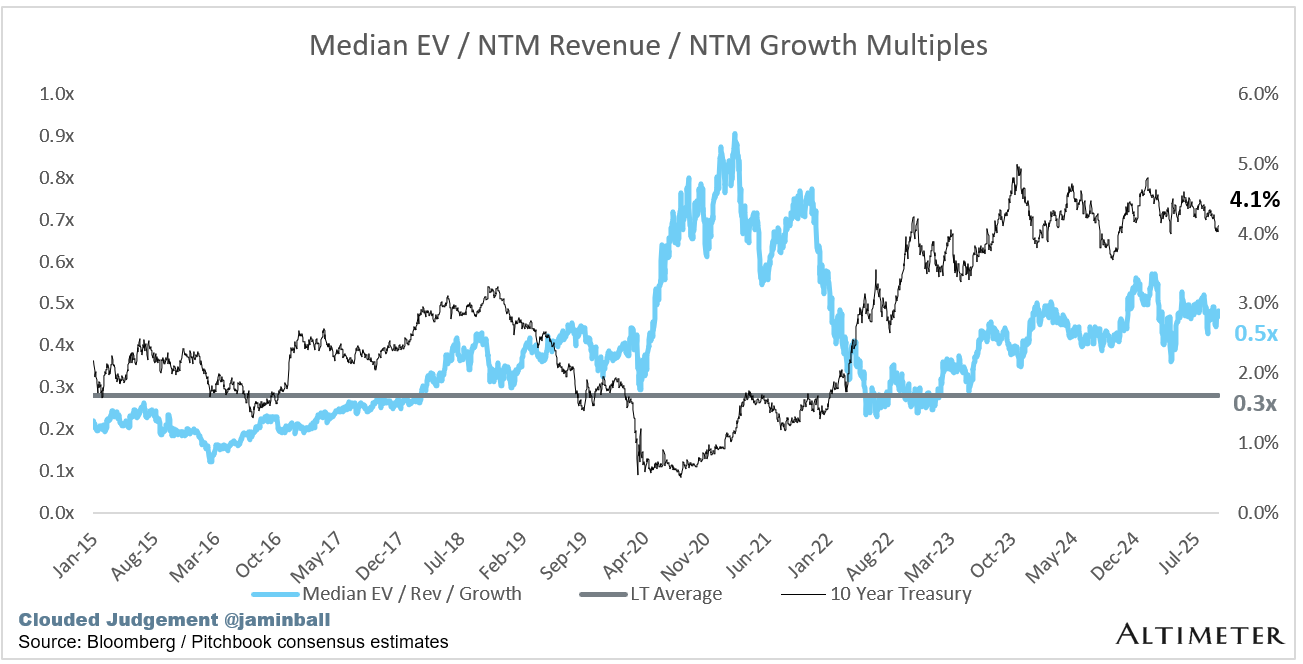
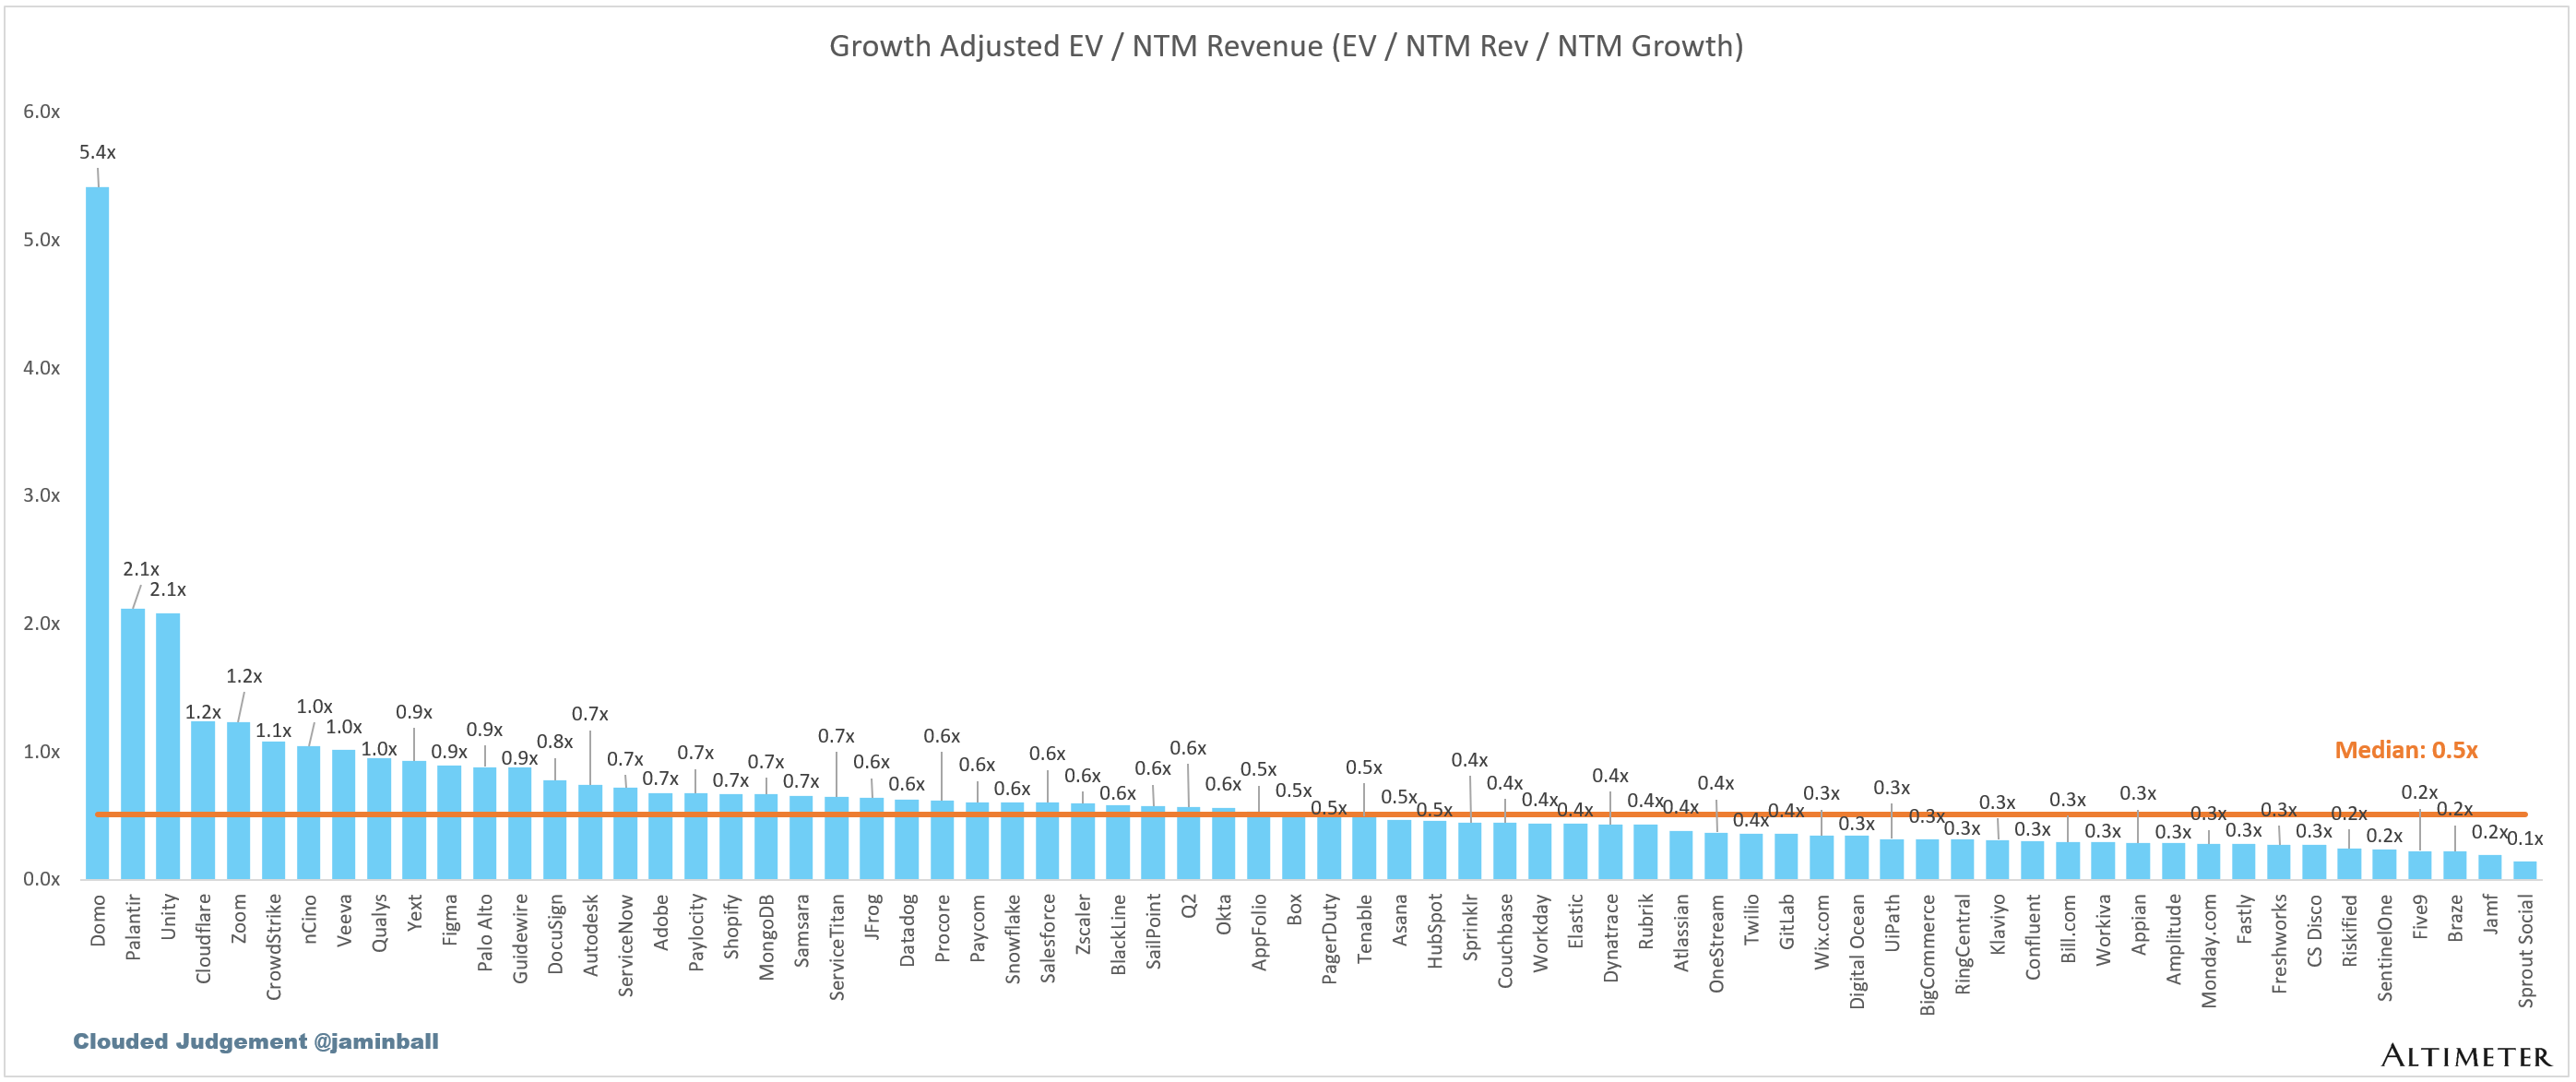
EV / NTM Rev / NTM Growth
The below chart shows the EV / NTM revenue multiple divided by NTM consensus growth expectations. So a company trading at 20x NTM revenue that is projected to grow 100% would be trading at 0.2x. The goal of this graph is to show how relatively cheap / expensive each stock is relative to its growth expectations.
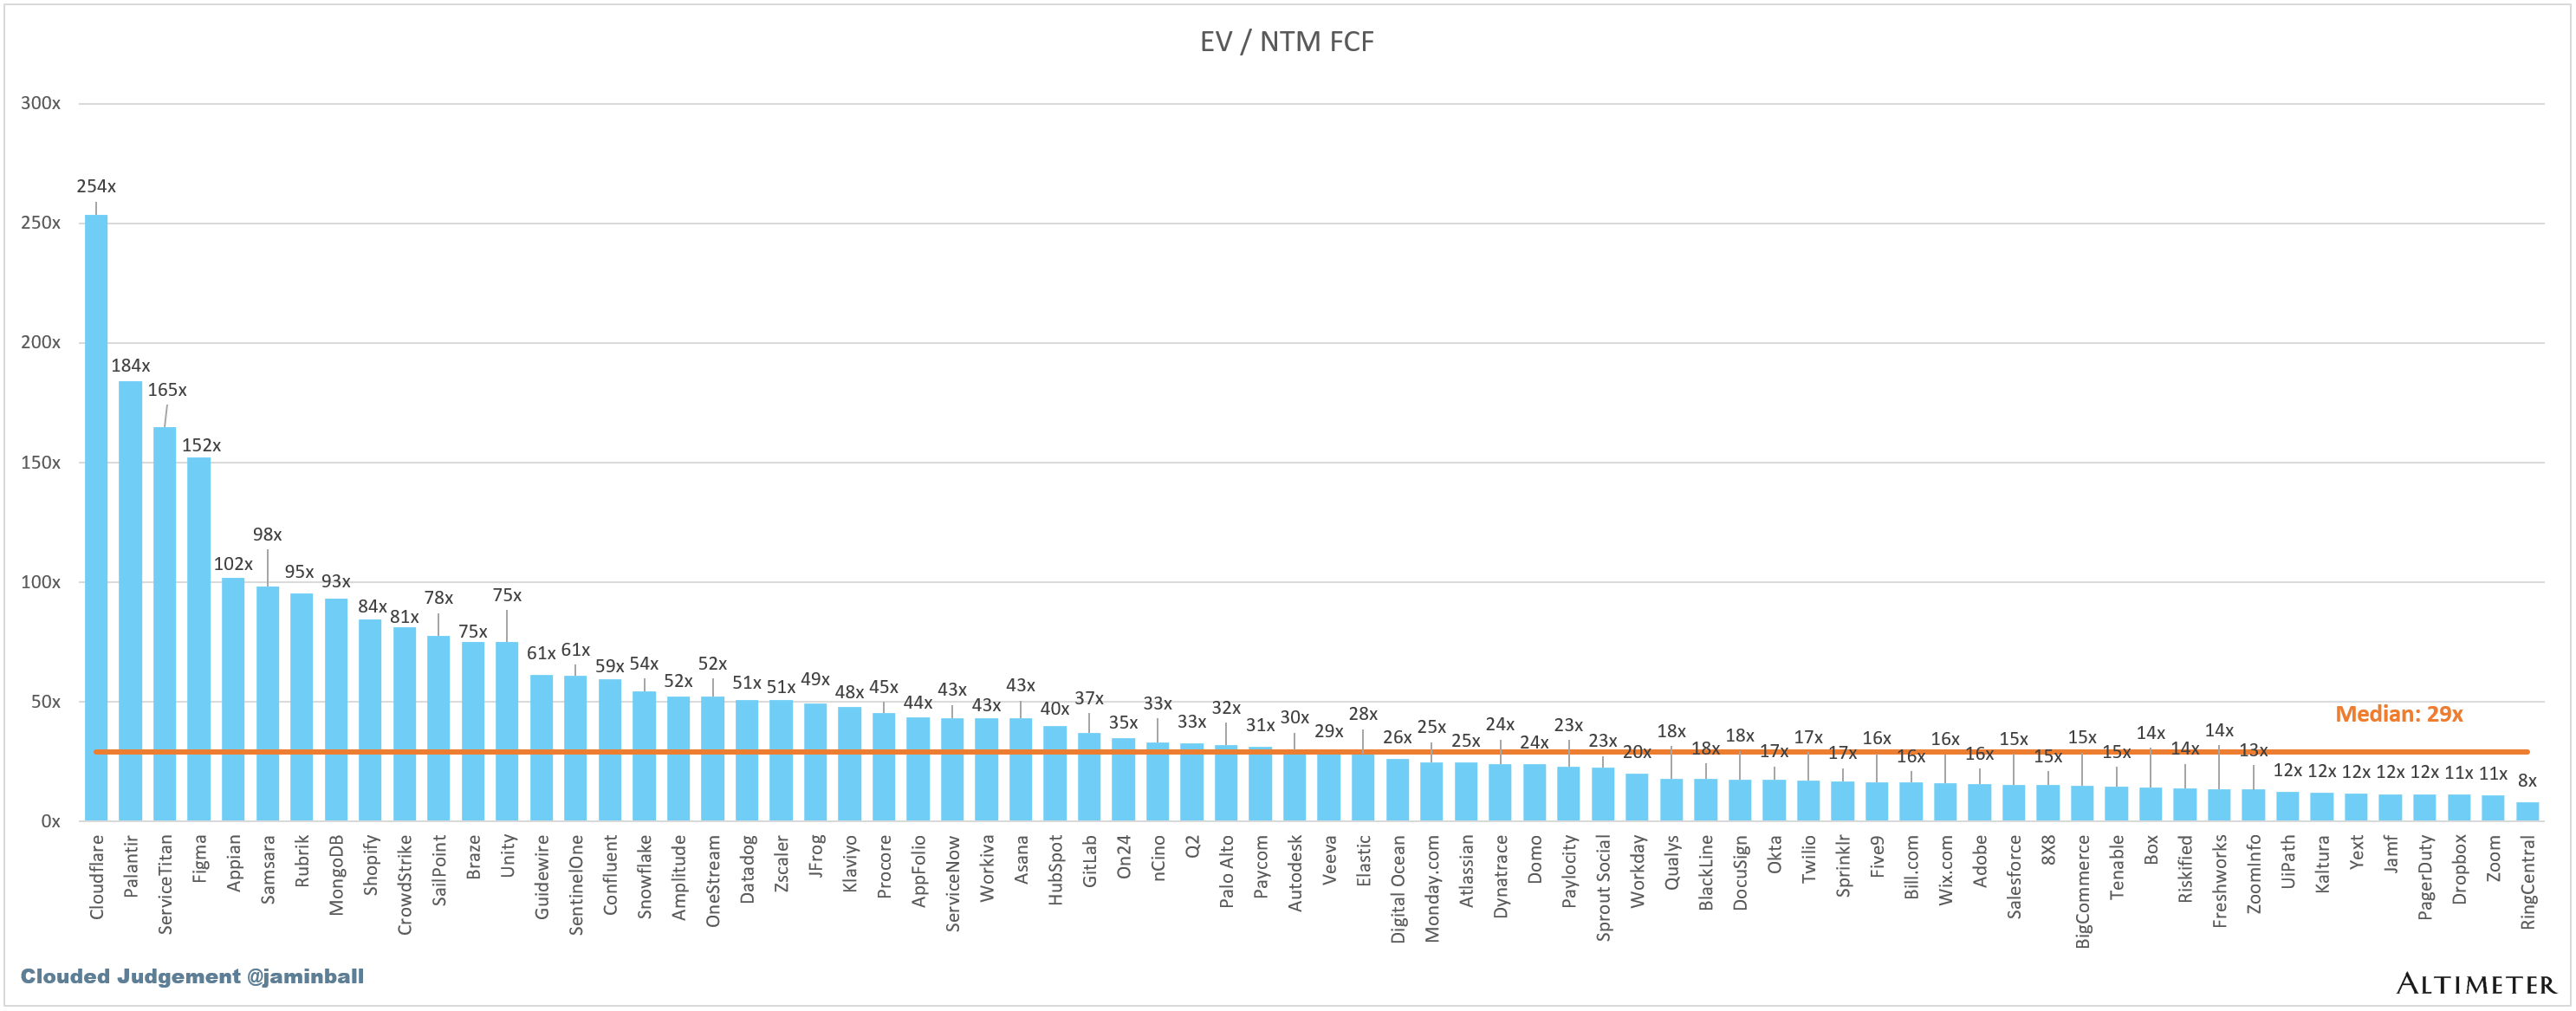
EV / NTM FCF
The line chart shows the median of all companies with a FCF multiple >0x and <100x. I created this subset to show companies where FCF is a relevant valuation metric.
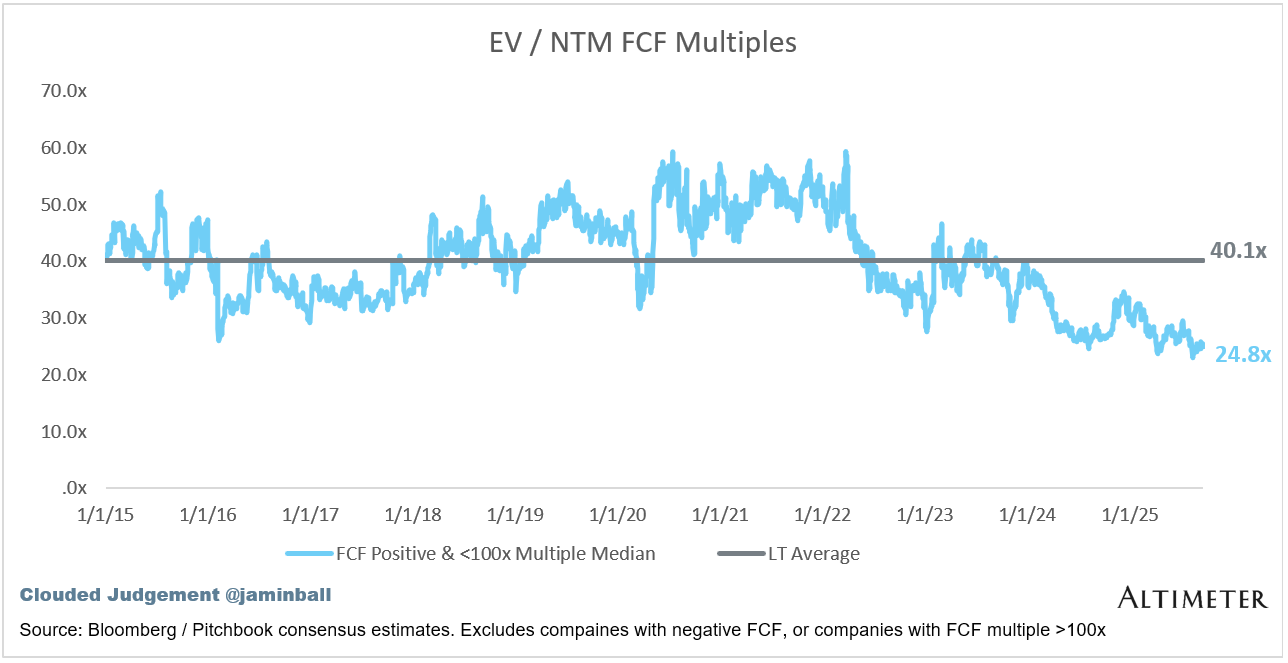
Companies with negative NTM FCF are not listed on the chart
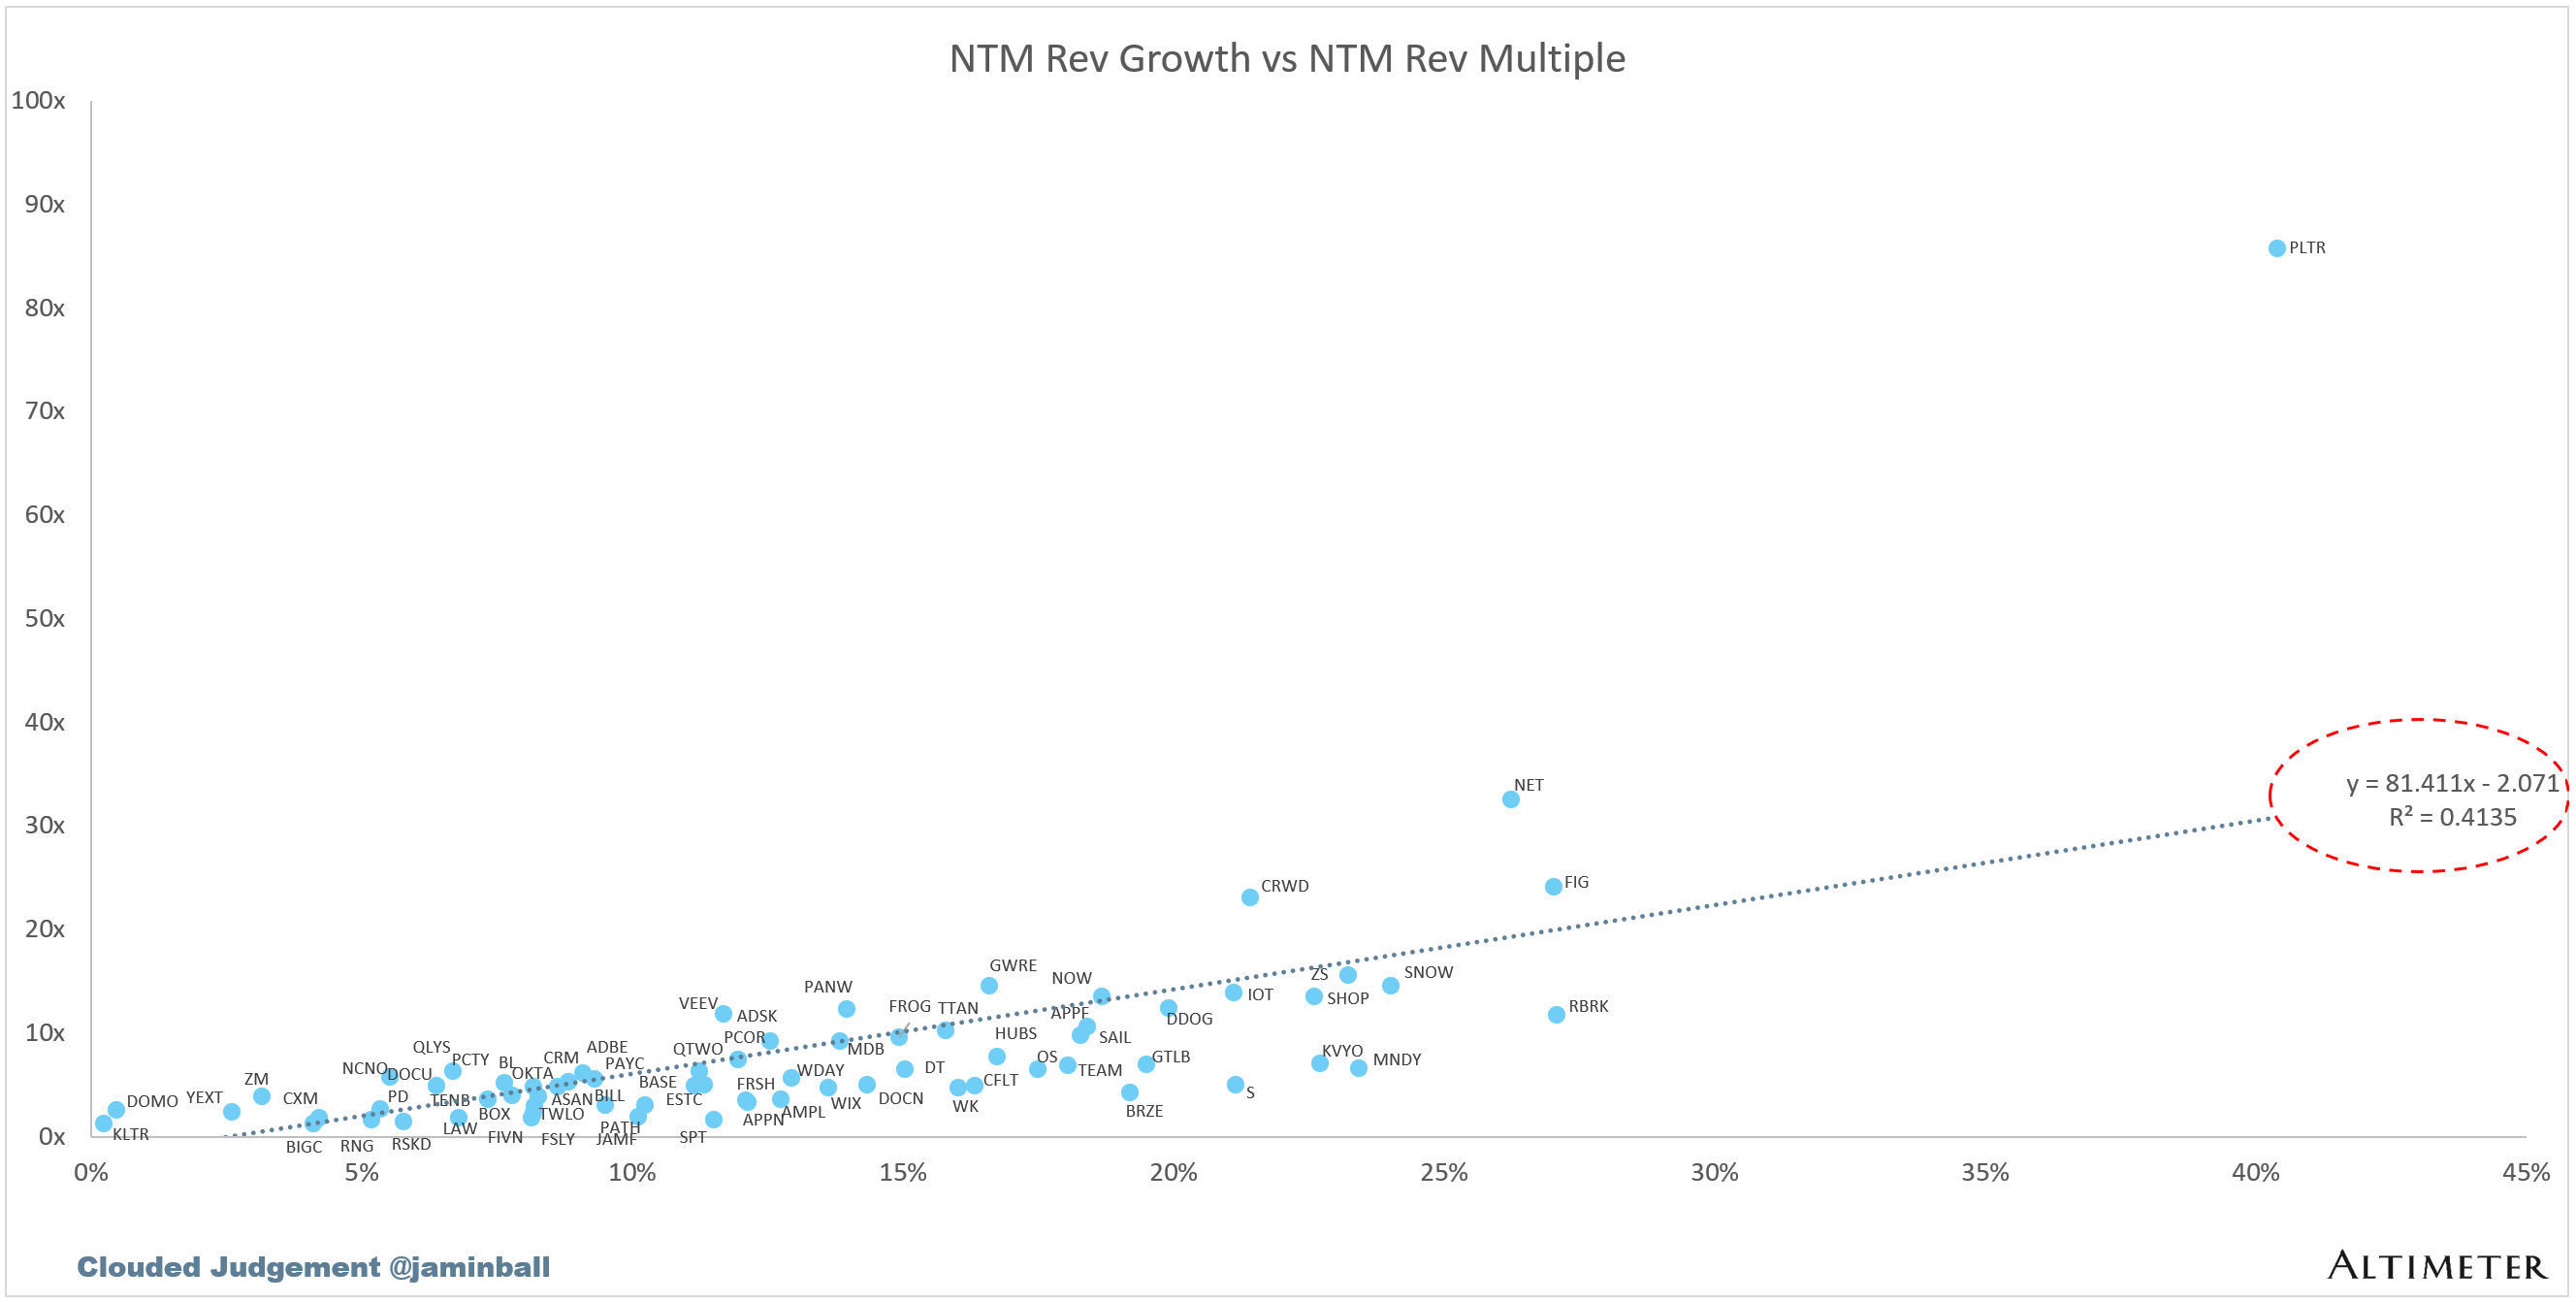
Scatter Plot of EV / NTM Rev Multiple vs NTM Rev Growth
How correlated is growth to valuation multiple?
Operating Metrics
Median NTM growth rate: 12%
Median LTM growth rate: 14%
Median Gross Margin: 76%
Median Operating Margin (2%)
Median FCF Margin: 18%
Median Net Retention: 108%
Median CAC Payback: 32 months
Median S&M % Revenue: 37%
Median R&D % Revenue: 24%
Median G&A % Revenue: 15%
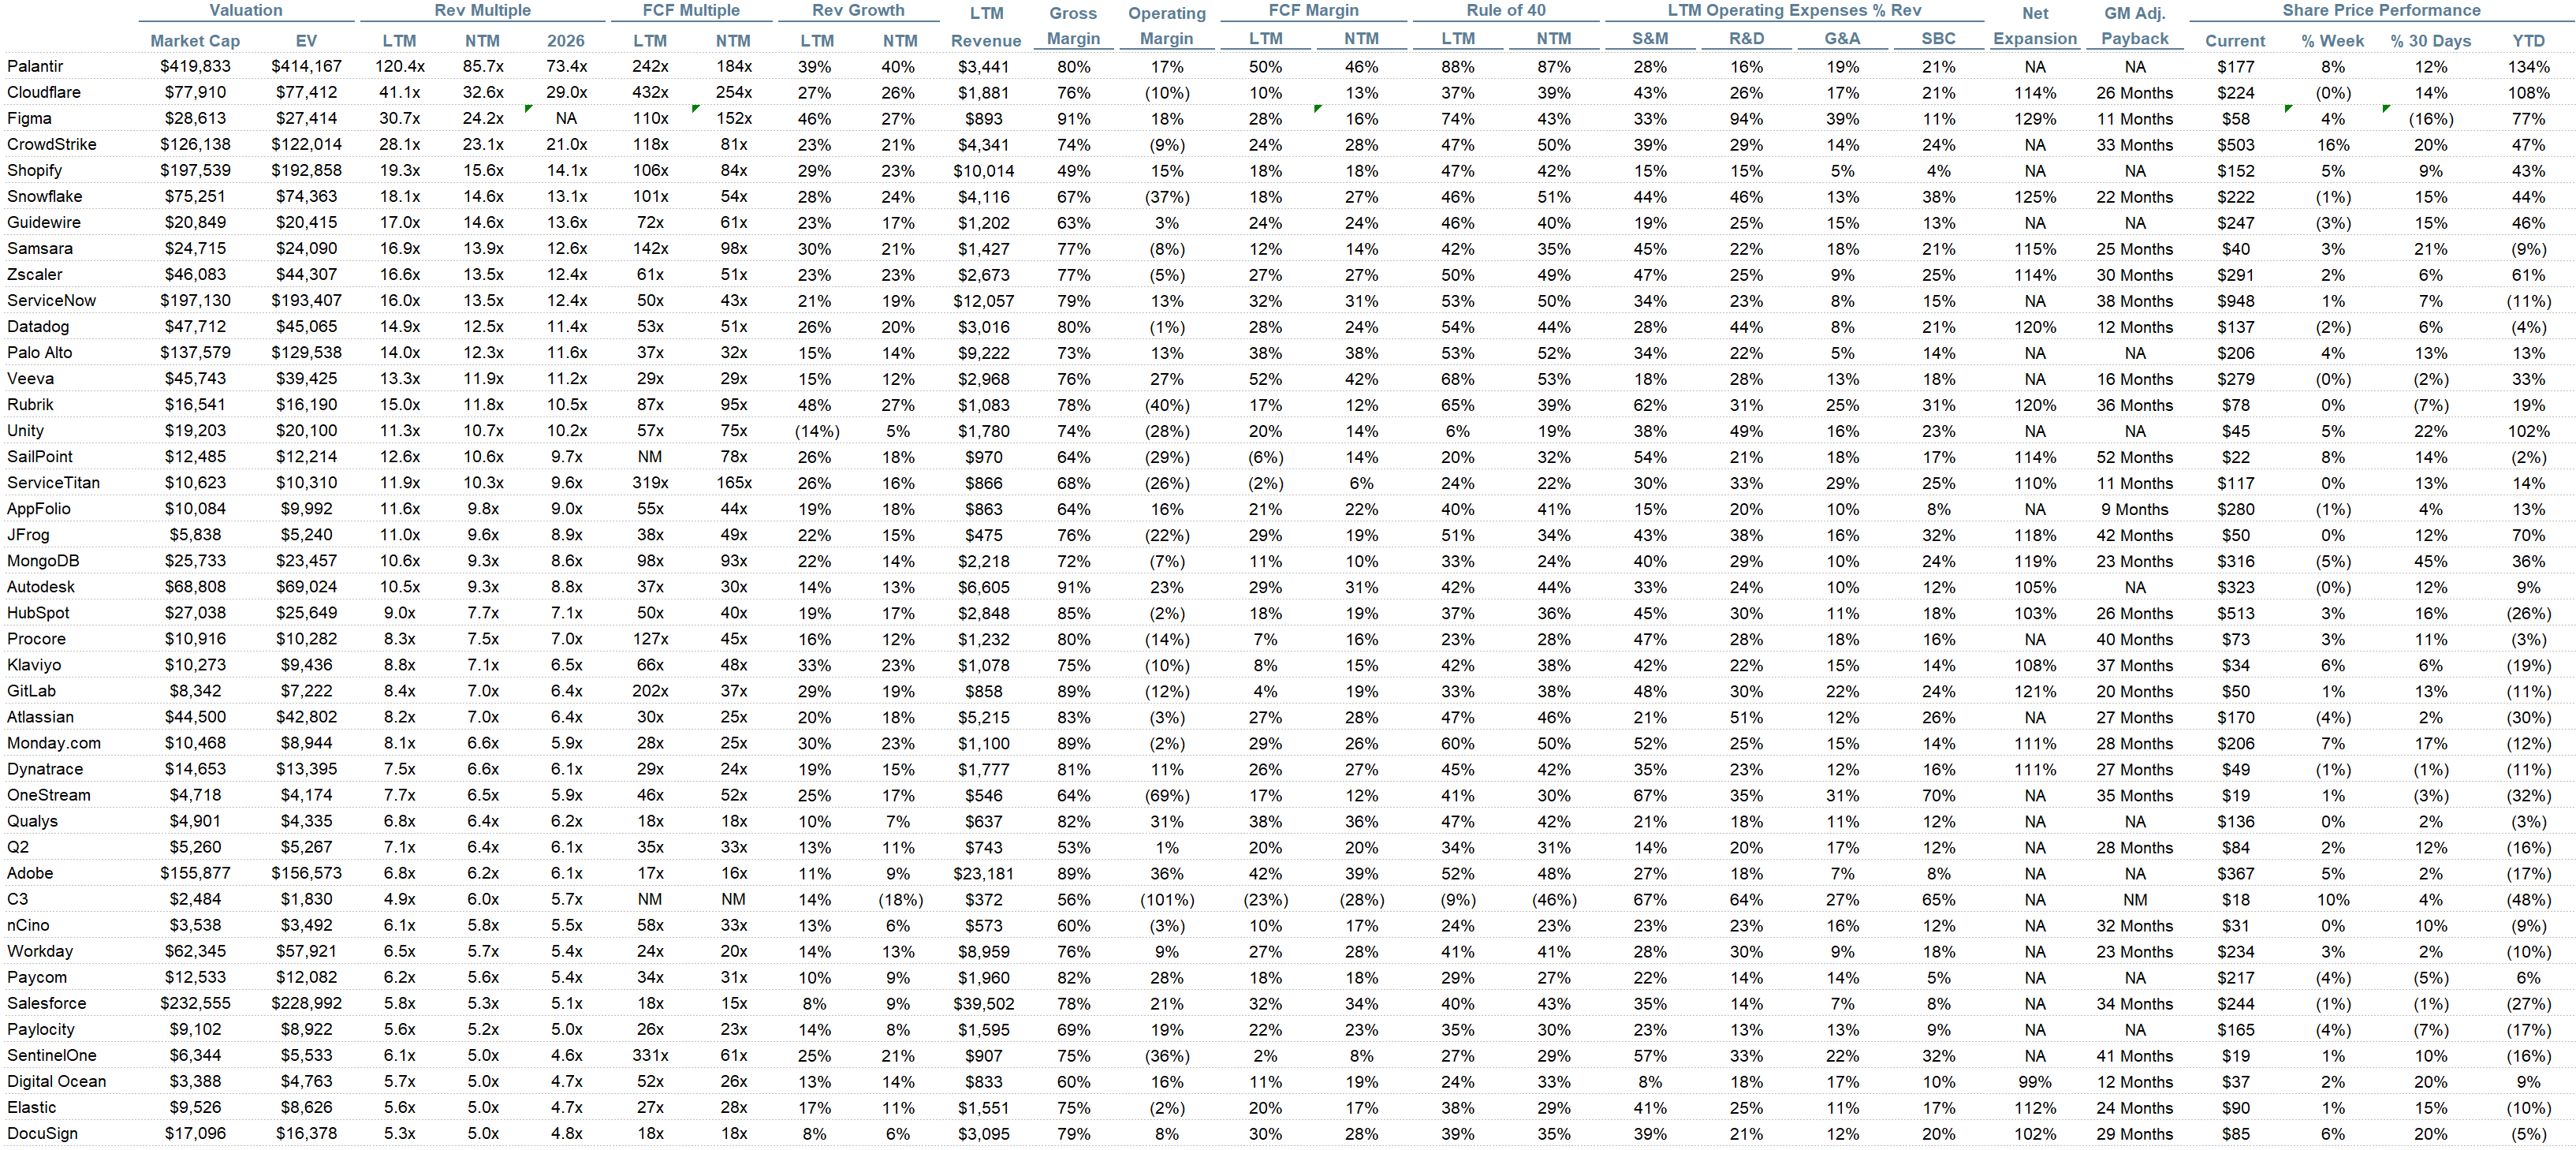
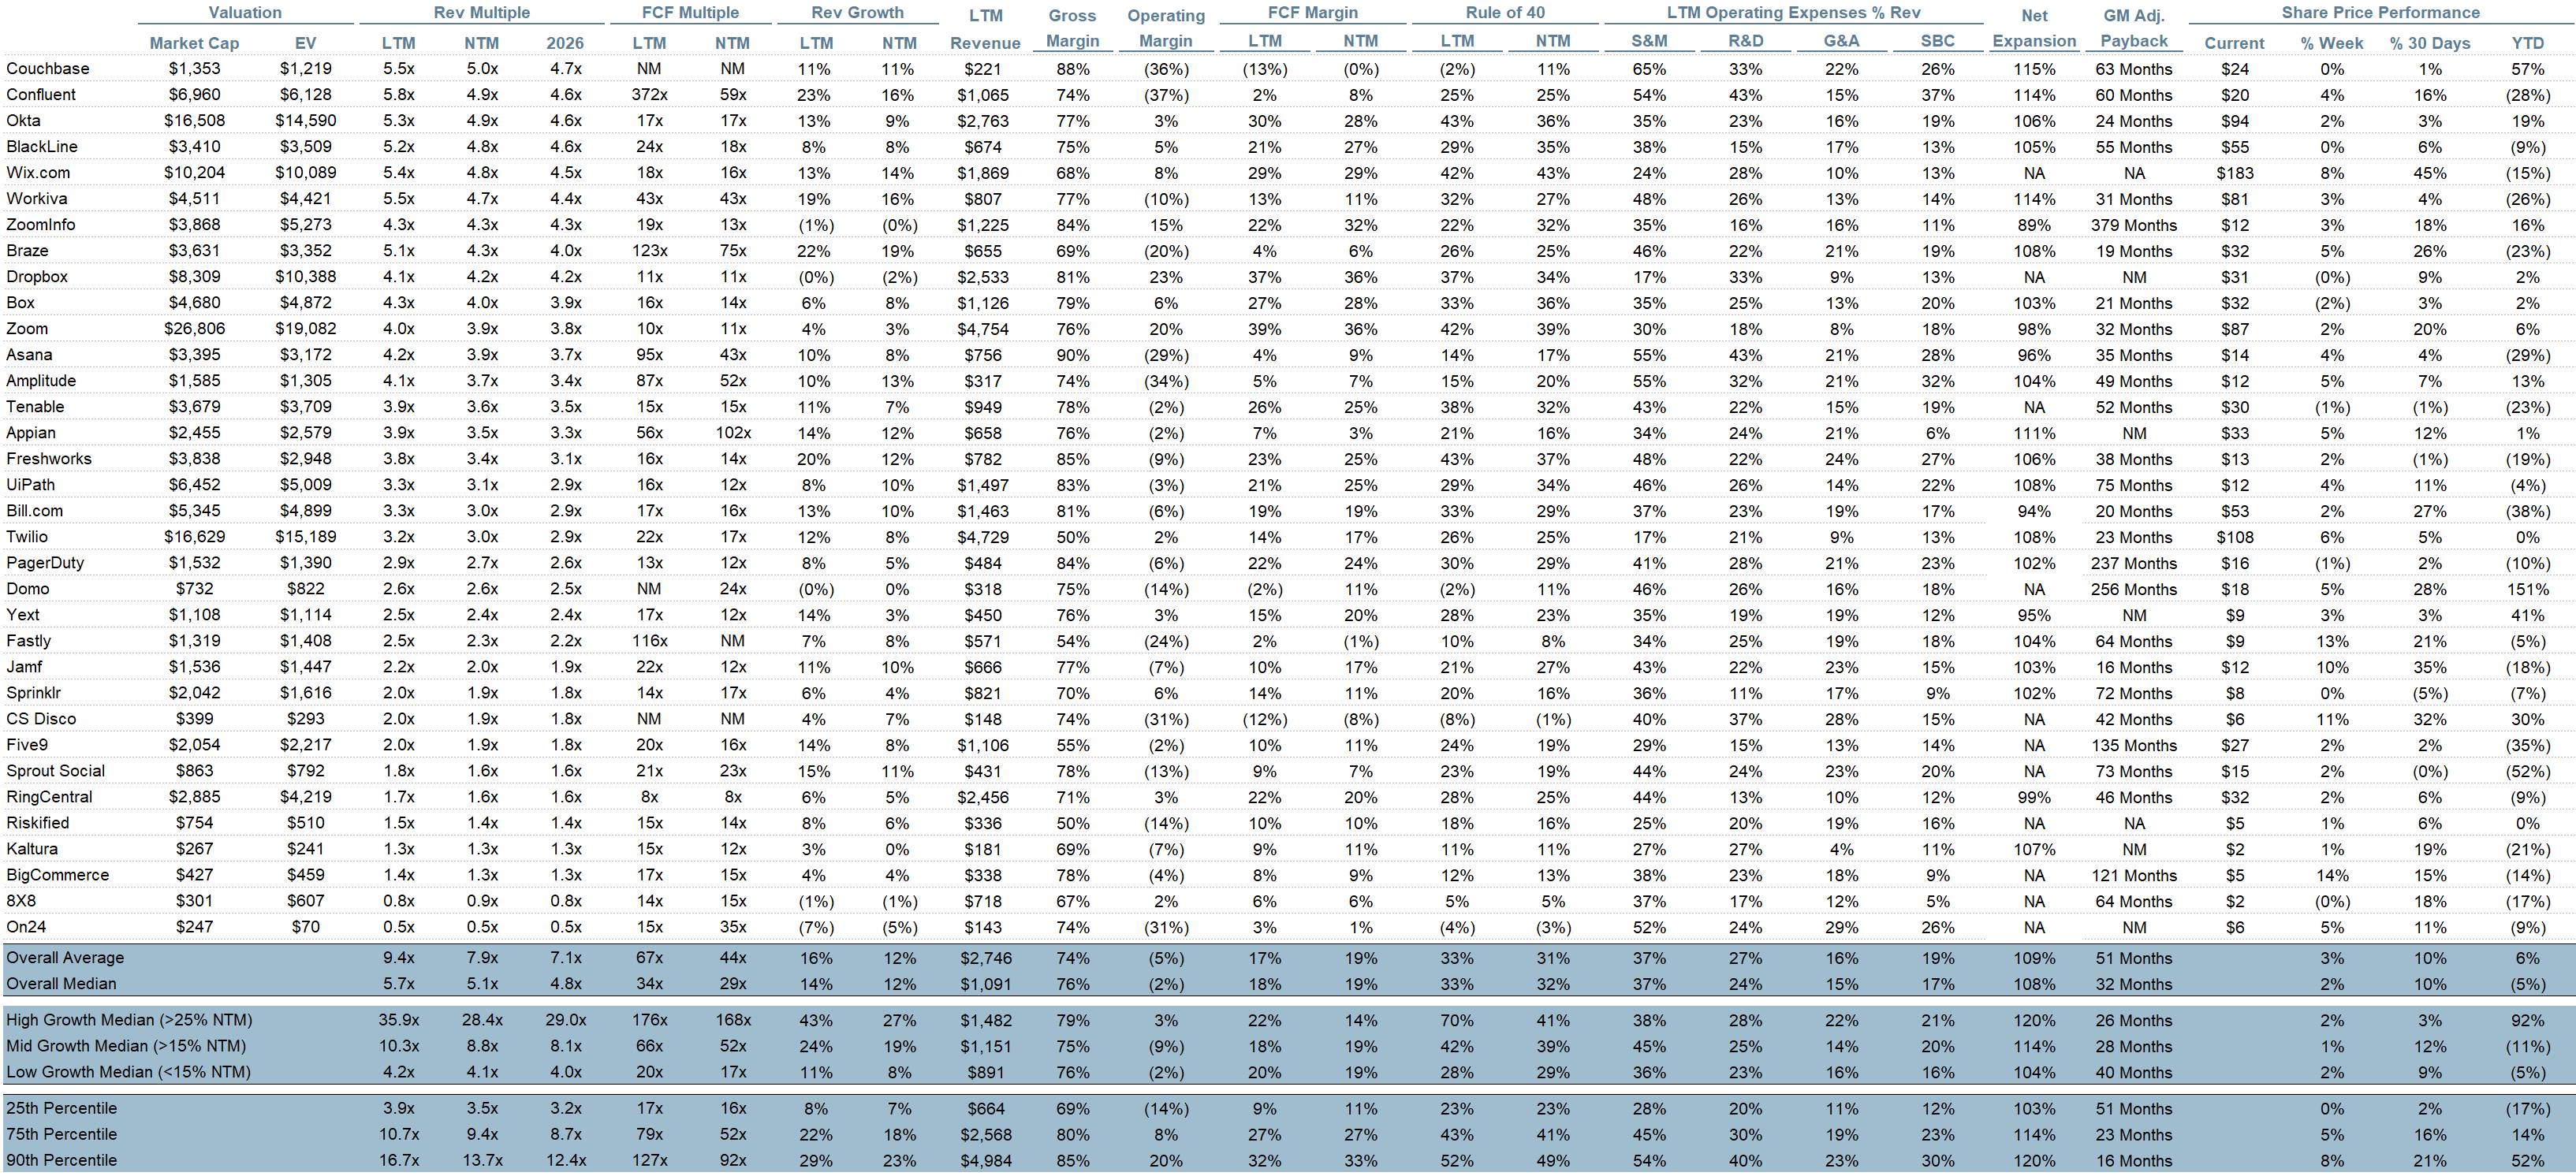
Comps Output
Rule of 40 shows rev growth + FCF margin (both LTM and NTM for growth + margins). FCF calculated as Cash Flow from Operations - Capital Expenditures
GM Adjusted Payback is calculated as: (Previous Q S&M) / (Net New ARR in Q x Gross Margin) x 12. It shows the number of months it takes for a SaaS business to pay back its fully burdened CAC on a gross profit basis. Most public companies don’t report net new ARR, so I’m taking an implied ARR metric (quarterly subscription revenue x 4). Net new ARR is simply the ARR of the current quarter, minus the ARR of the previous quarter. Companies that do not disclose subscription rev have been left out of the analysis and are listed as NA.
Sources used in this post include Bloomberg, Pitchbook and company filings
The information presented in this newsletter is the opinion of the author and does not necessarily reflect the view of any other person or entity, including Altimeter Capital Management, LP ("Altimeter"). The information provided is believed to be from reliable sources but no liability is accepted for any inaccuracies. This is for information purposes and should not be construed as an investment recommendation. Past performance is no guarantee of future performance. Altimeter is an investment adviser registered with the U.S. Securities and Exchange Commission. Registration does not imply a certain level of skill or training. Altimeter and its clients trade in public securities and have made and/or may make investments in or investment decisions relating to the companies referenced herein. The views expressed herein are those of the author and not of Altimeter or its clients, which reserve the right to make investment decisions or engage in trading activity that would be (or could be construed as) consistent and/or inconsistent with the views expressed herein.
This post and the information presented are intended for informational purposes only. The views expressed herein are the author’s alone and do not constitute an offer to sell, or a recommendation to purchase, or a solicitation of an offer to buy, any security, nor a recommendation for any investment product or service. While certain information contained herein has been obtained from sources believed to be reliable, neither the author nor any of his employers or their affiliates have independently verified this information, and its accuracy and completeness cannot be guaranteed. Accordingly, no representation or warranty, express or implied, is made as to, and no reliance should be placed on, the fairness, accuracy, timeliness or completeness of this information. The author and all employers and their affiliated persons assume no liability for this information and no obligation to update the information or analysis contained herein in the future.