Clouded Judgement 9.2.22
Every week I’ll provide updates on the latest trends in cloud software companies. Follow along to stay up to date!
Market Thoughts
What a week. The 10Y is back up to 3.3% and the median software multiple is back to its June lows. After Powell spoke last Friday his message was clear - everyone who thought they interpreted a Fed Pivot in July was wrong. Powell reiterated the Fed’s commitment to fighting inflation, and acknowledged this will cause “some pain.” He also seemed to shut the door on those calling for rate cuts next year. He made a couple clear points - “the economy continues to show strong underlying momentum.” and “The labor market is particularly strong, but it is clearly out of balance, with demand for workers substantially exceeding the supply of available workers.” Couple this with his comment “Restoring price stability will take some time and requires using our tools forcefully to bring demand and supply into better balance. Reducing inflation is likely to require a sustained period of below-trend growth. Moreover, there will very likely be some softening of labor market conditions. While higher interest rates, slower growth, and softer labor market conditions will bring down inflation, they will also bring some pain to households and businesses.” The key word here being “some pain.” The market took this as “even if we do hit a recession next year, the Fed will not let up on rates. They’ll keep rates as high as they need to, for as long as they need to, in order to get inflation down. And if they had to choose between lowering rates too soon or too late, they’re picking too late.
I’ve made reference to Paul Volcker here before, but here’s the quick refresher on the parallels between Powell and Volcker. Paul Volcker served as the chair of the Fed from 1979 to 1987. Volcker succeeded Arthur Burns who served as the chair of the Fed from 1970 to 1978. During Burns’ tenure, inflation ran rampant. In the mid 70’s it peaked ~12%! The Fed was able to get inflation down to ~5% and then took their foot off the gas (ie didn’t keep rates high). Unfortunately, this resulted in inflation picking back up to an even higher peak of ~15% in 1980. The main critism of Burns is that he didn’t keep rates high enough for long enough to get inflation down to the 2% target. Volcker was left to clean up the mess, and ended up hiking the fed funds rate to ~20%! Volker was clear he had one mission - get inflation back down to 2% target at all costs. This caused a deeper ~18 month recession, but in the end he seceded in getting inflation back to ~2%. The chart below shows CPI, with the first red circle being the peak with Burns (and following drop), followed by the rebound and peak during Volcker’s tenure.
I explain all of this to make the following point - Powell does NOT want to make the same mistakes as Burns. On the contrary, he wants to be remembered as Volcker - someone who stopped at nothing to bring inflation down, even if it causes “some pain.” I think the market appreciates this more now coming out of last Friday.
At the same time, we’re starting to see a few more cracks in the fundamentals of software, and investors are begging the question “with a deeper recession coming, have numbers come down enough?” On Wednesday Mongo reported some weakness in consumption, and called out that these trends were continuing in August. Prior, Mongo was viewed as more bullet proof - a mission critical business, with sticky consumption. While I didn’t actually think their quarter was actually that bad (outside of bringing down margin guidance I actually thought it was pretty solid), any chinks in their armor could point to rockier times ahead for the rest of the sector.
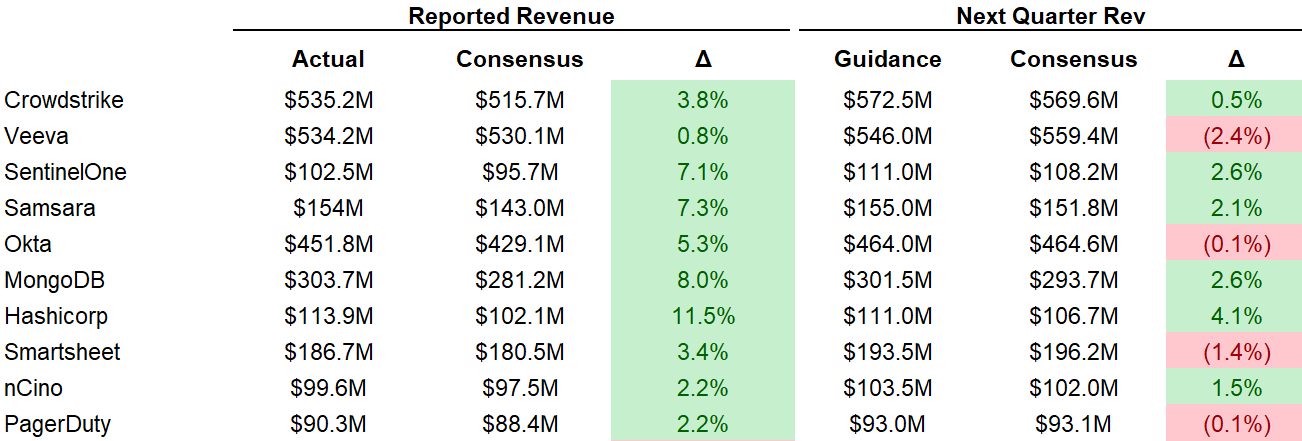
For the most part, we’re seeing beats in Q2, followed by weak guides. But it’s really hard to tell how much of the weak guides are due to conservatism, or weakness actually showing up. Just about all companies so far are not flowing beats through year end guidance. What I mean by this - a company may beat Q2 by $10m, but then only raise full year guidance by $2m. And often times the weak full year guide is blamed on conservatism.
It’s hard to pick up too many specifics from earnings calls. Below are some quotes from Mongo / Okta on macro impact who reported Wednesday this week and got absolutely hammered in the market on Thursday (both down >25%)
Quarterly Reports Summary
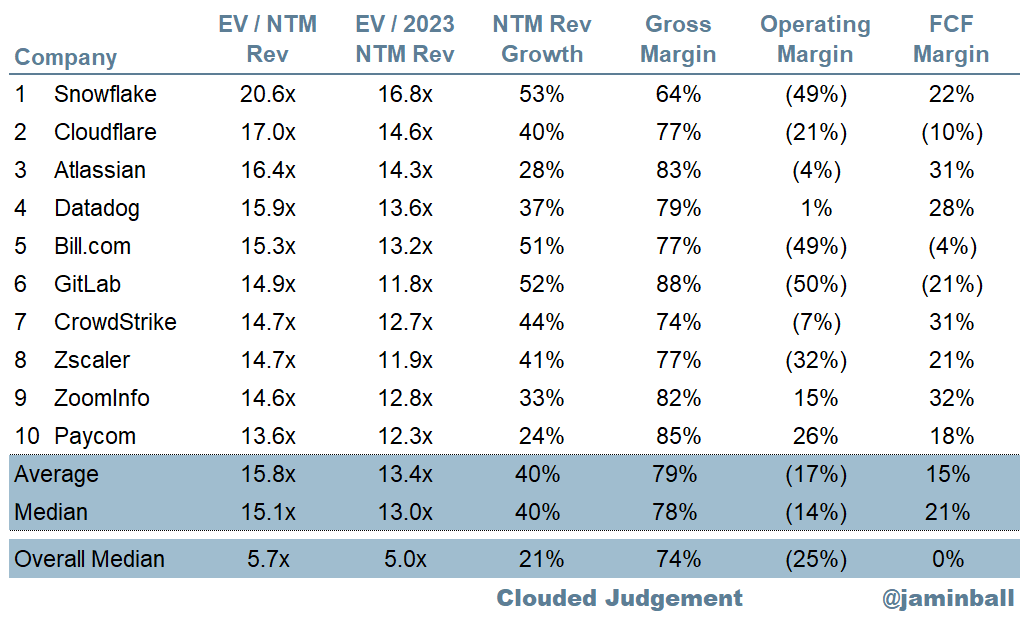
Top 10 EV / NTM Revenue Multiples
Top 10 Weekly Share Price Movement
Update on Multiples
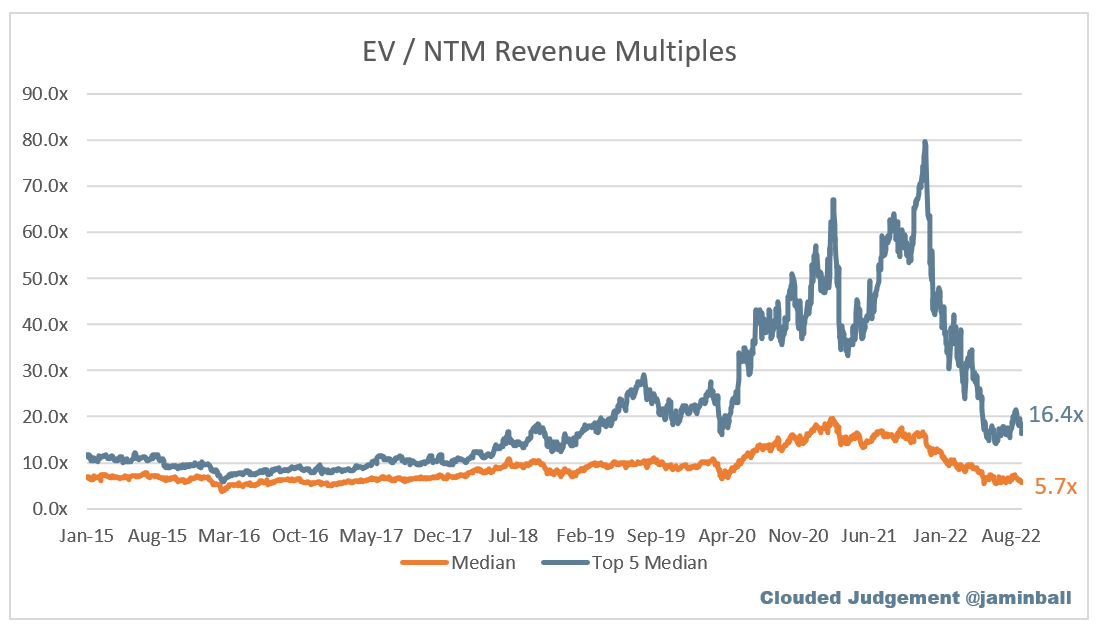
SaaS businesses are valued on a multiple of their revenue - in most cases the projected revenue for the next 12 months. Multiples shown below are calculated by taking the Enterprise Value (market cap + debt - cash) / NTM revenue.
Overall Stats:
Overall Median: 5.7x
Top 5 Median: 16.4x
10Y: 3.3%
Bucketed by Growth. In the buckets below I consider high growth >30% projected NTM growth, mid growth 15%-30% and low growth <15%
High Growth Median: 10.0x
Mid Growth Median: 5.7x
Low Growth Median: 3.7x
Scatter Plot of EV / NTM Rev Multiple vs NTM Rev Growth
How correlated is growth to valuation multiple?
Growth Adjusted EV / NTM Rev
The below chart shows the EV / NTM revenue multiple divided by NTM consensus growth expectations. The goal of this graph is to show how relatively cheap / expensive each stock is relative to their growth expectation
Operating Metrics
Median NTM growth rate: 21%
Median LTM growth rate: 31%
Median Gross Margin: 74%
Median Operating Margin (25%)
Median FCF Margin: 0%
Median Net Retention: 120%
Median CAC Payback: 34 months
Median S&M % Revenue: 48%
Median R&D % Revenue: 28%
Median G&A % Revenue: 20%
Comps Output
Rule of 40 shows LTM growth rate + LTM FCF Margin. FCF calculated as Cash Flow from Operations - Capital Expenditures
GM Adjusted Payback is calculated as: (Previous Q S&M) / (Net New ARR in Q x Gross Margin) x 12 . It shows the number of months it takes for a SaaS business to payback their fully burdened CAC on a gross profit basis. Most public companies don’t report net new ARR, so I’m taking an implied ARR metric (quarterly subscription revenue x 4). Net new ARR is simply the ARR of the current quarter, minus the ARR of the previous quarter. Companies that do not disclose subscription rev have been left out of the analysis and are listed as NA.
This post and the information presented are intended for informational purposes only. The views expressed herein are the author’s alone and do not constitute an offer to sell, or a recommendation to purchase, or a solicitation of an offer to buy, any security, nor a recommendation for any investment product or service. While certain information contained herein has been obtained from sources believed to be reliable, neither the author nor any of his employers or their affiliates have independently verified this information, and its accuracy and completeness cannot be guaranteed. Accordingly, no representation or warranty, express or implied, is made as to, and no reliance should be placed on, the fairness, accuracy, timeliness or completeness of this information. The author and all employers and their affiliated persons assume no liability for this information and no obligation to update the information or analysis contained herein in the future.


Love reading your weekly updates. Thanks for publishing such actionable insights into growth companies and their valuations.
The macro message you outlined is verbatim what Ackman presented to the FED on July 13th