Every week I’ll provide updates on the latest trends in cloud software companies. Follow along to stay up to date!
Kingmaking in the Era of AI
When too many kings vie for the crown, you’re left with a brutal game of thrones. Can anyone truly win in a game of thrones? And will the end justify the means?
I’ve been thinking about this a lot recently. Right now, there is A LOT of king-making happening in venture capital rounds in the AI space. Just this week a couple month old company raised $1b dollars. This is not a commentary on that company or it’s prospects. It could be a great investment, and they have one of the best AI teams assembled. But the round dynamics, and many other rounds like it, remind me of king making rounds.
What is a king making round? We saw a lot of these pop up around the Softbank Vision fund and later in the 2021 period. The idea is that you can use capital as a weapon to anoint a winner in a category, while simultaneously disincentivizing further investments in competitors. That capital is then used (in general) in one of two ways:
To fund meaningful capex to achieve significant hardware breakthroughs only achievable with large quantums of capital others won’t have access to. Think companies like SpaceX or Anduril. It takes significant capital to get to where they are, and once you have a “king” in a category, there aren’t many incentives to fund (ie give more capital) others trying to compete directly.
To fund significant customer acquisition costs to capture market share. This is more prevalent in the consumer space (10 minute grocery delivery, ride share, dog walking apps, etc), but also shows up in enterprise sales from time to time. The idea is you can fund (sometimes grossly) unprofitable customer acquisition costs, reach some level of network effects and market share dominance, and then use your manufactured monopoly to exert pricing power on your customers (ie increase prices)
However - there are a couple things to call out here.
First, let’s look at Anduril in bucket one. They FIRST became a king, and THEN raised significant amounts of capital. They built the business WITHOUT a king making round. It’s incredibly impressive, and the order of operations matters. There is a school of thought today that wants to take a short cut, and flip that order of operations (first raise money, then become a king). It’s not clear to me that will work - would $1b of capital on Anduril’s balance sheet in their first few months of operations changed their outcome? Would it have sped up their time to success? Or would it have provided a big spend vacuum of distractions where they were crippled under the weight of that capital?
Second - let’s look at bucket two. The are two KEY assumptions here that would justify this strategy. The first assumption is that at the end of the rapid customer acquisition spend you will end up as the monopoly or duopoly leader (with, importantly, pricing power). The second assumption is that your customers will be sticky and retain (generally because of network effects, or lack of a viable alternative). Without these, the means (spend on unprofitable acquisition) won’t justify the end state, and the companies executing these strategies only exist at the beneficence of capital providers (venture capital, public market, private credit, etc). We know how most of these movies end… The end state is not a business model with monpolistic margins, or a sticky customer base.
If you haven’t already picked up on the tone of my article I’ll make it explicit - King Making historically hasn’t been very successful as a company building or investment strategy. The best companies like Anduril first became kings, then raised treasure troves of cash. What I want to try and answer for myself is “will it be different this time with AI?” Can king making actually be a good strategy, or will it play out like it has historically?
So first - what’s different about AI this time around (both on company and market dynamics)? Couple random thoughts I’ll try and digest at the end
The capital in the system has exploded. The number of traditional venture capital funds that are each multiple billion in size has exploded. At the same time, corporate venture arms (or just corporate balance sheets) are investing at significant scale. In short, the dollars on the sideline capable of deploying a king making strategy have gone way up, and there are a lot of incentives to “deploy as quickly as possible”
There really are significant “fixed” costs to get going. The ante to play the game is high, these AI companies are capital intensive. Training a model requires real money. And I put fixed in “ ” because it’s not truly fixed, there will always be another generation of model that requires even more costs. So not truly fixed…
The competitive landscape is fierce. Both from startups as well as very well capitalized and motivated incumbents with massive balance sheets (like Meta). Will the end result really be monopolistic-like margins?
So how do I digest all of this? There has never been a bigger incentive to deploy a king making strategy from the investing side (bigger funds = more fees!). As venture has institutionalized as an asset class, it’s starting to look a lot more like PE (AUM accumulating). And some of the recent “acquihire / licensing” acquisitions give the hope of downside protection when investing in great people / teams, and can “justify” doing the king making deals (option value, all upside if it works). If you have a prince (and there are only so many), why not make him a king?
At the same time, a big learning for me personally over the last few years is how dangerous a large balance sheet can be early in a companies life. It sounds counterintuitive, but it’s real. Large balance sheets generally lead to lots of careless experimentation in parallel. It’s harder to know what investments (spend) drive an outcome when 6 investments are run in parallel. This makes it harder to then find the things that are actually working, and prioritize them. Or worse, the wrong conclusion is drawn, and the wrong experiment is then scaled up. Large balance sheets also often lead to hiring way too quickly. Organizations can only effectively onboard so many people in a year. And the risks of hiring to quickly have culture impacts, and can lead to too many employees joining for the wrong reason (“we thought it was a rocket ship and wanted to make money!”). These folks are often the first to leave… A related paradox I believe to be true is smaller teams move faster. Another risk of over hiring due to a large balance sheet.
An additional difference from past waves of king making - historically king making has disincentivized investments in competitors. Why invest hundreds of millions into the next dog walking app if there are already two leaders? My goal is not to compare the AI opportunity to the dog walking opportunity (not at all, I think the AI opportunity is very real), but to instead highlight the difference in mentality of the funding markets. Funding markets are TOTALLY FINE funding competitor number 4, 5, 6, etc in one space. Part of the reason is what I described above (and in prior posts) - the incentive is to deploy. Another reason is the size of the prize COULD be so massive it’s worth it.
The biggest question I have is that in such a fierce competitive environment that is ripe with capital on the sidelines to fund any and all competitors, will the end state be “good businesses” with differentiated margins? In a world with 5+ model companies, will they all have good gross margins or will it be a race to the bottom on price? Same question for all of the inference engines or coding assistants or customer support or medical scribes etc.
The end state may very well be one or two Kings emerge in each category. IF that happens, there will be A LOT of carnage along the way. Given how plentiful capital markets are today, the game of thrones to get down to one or two leaders will take a long time. Capital will be incinerated along the way. There will be significantly more companies that flame out given how many have raised capital.
I don’t think I’ve fully formed a view on whether “it’s different this time” with respect to the king making rounds. It’s not obvious to me we will have “monopolistic margin structures” at the end state, and at the rate compute is becoming cheaper it’s also not obvious how significant the capital barriers will be in the future. At the same time, a “floor” has been established for exceptional talents in the form of these weird license / acquihire type acquisitions, so while I don’t think the king making rounds are a sound investment strategy, I can understand the rationale for doing them
Q2 Earnings Check In
We’re just about finished with Q2 ‘24 software earnings. I’ll put together my standard quarterly recap in a few weeks, but a couple charts below.
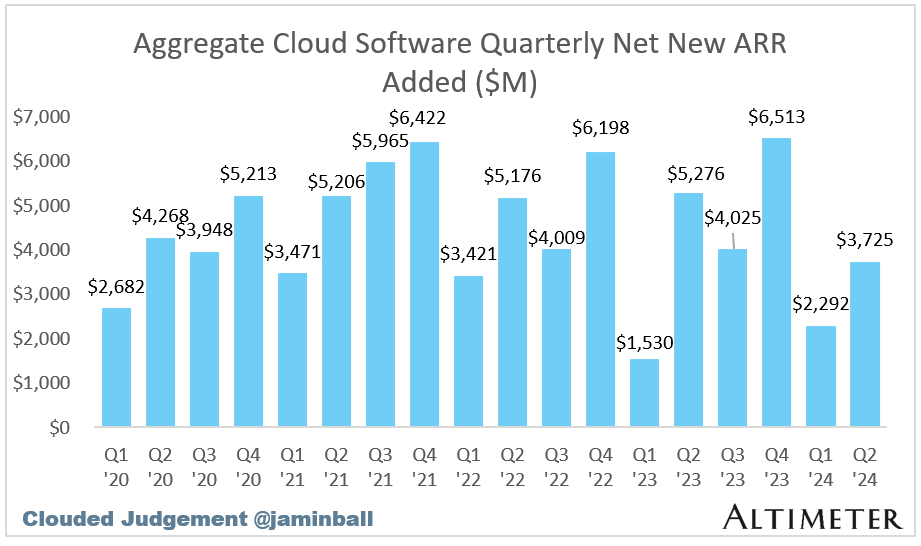
First, aggregate net new ARR added in the quarter. While it increased from Q1 to Q2, it was still well below Q2 of last year. It still feels tough out there selling software
Second, the median YoY growth in quarterly net new ARR added. Unfortunately this figure ticked down for the 3rd quarter in a row. It looked like we were headed for a “v shaped recovery” on this metric, but the last few quarters have proven otherwise
Quarterly Reports Summary
Top 10 EV / NTM Revenue Multiples
Top 10 Weekly Share Price Movement
Update on Multiples
SaaS businesses are generally valued on a multiple of their revenue - in most cases the projected revenue for the next 12 months. Revenue multiples are a shorthand valuation framework. Given most software companies are not profitable, or not generating meaningful FCF, it’s the only metric to compare the entire industry against. Even a DCF is riddled with long term assumptions. The promise of SaaS is that growth in the early years leads to profits in the mature years. Multiples shown below are calculated by taking the Enterprise Value (market cap + debt - cash) / NTM revenue.
Overall Stats:
Overall Median: 5.0x
Top 5 Median: 14.3x
10Y: 3.7%
Bucketed by Growth. In the buckets below I consider high growth >27% projected NTM growth (I had to update this, as there’s only 1 company projected to grow >30% after this quarter’s earnings), mid growth 15%-27% and low growth <15%
High Growth Median: 8.7x
Mid Growth Median: 8.1x
Low Growth Median: 3.8x
EV / NTM Rev / NTM Growth
The below chart shows the EV / NTM revenue multiple divided by NTM consensus growth expectations. So a company trading at 20x NTM revenue that is projected to grow 100% would be trading at 0.2x. The goal of this graph is to show how relatively cheap / expensive each stock is relative to their growth expectations
EV / NTM FCF
The line chart shows the median of all companies with a FCF multiple >0x and <100x. I created this subset to show companies where FCF is a relevant valuation metric.
Companies with negative NTM FCF are not listed on the chart
Scatter Plot of EV / NTM Rev Multiple vs NTM Rev Growth
How correlated is growth to valuation multiple?
Operating Metrics
Median NTM growth rate: 11%
Median LTM growth rate: 15%
Median Gross Margin: 74%
Median Operating Margin (9%)
Median FCF Margin: 16%
Median Net Retention: 110%
Median CAC Payback: 42 months
Median S&M % Revenue: 40%
Median R&D % Revenue: 25%
Median G&A % Revenue: 16%
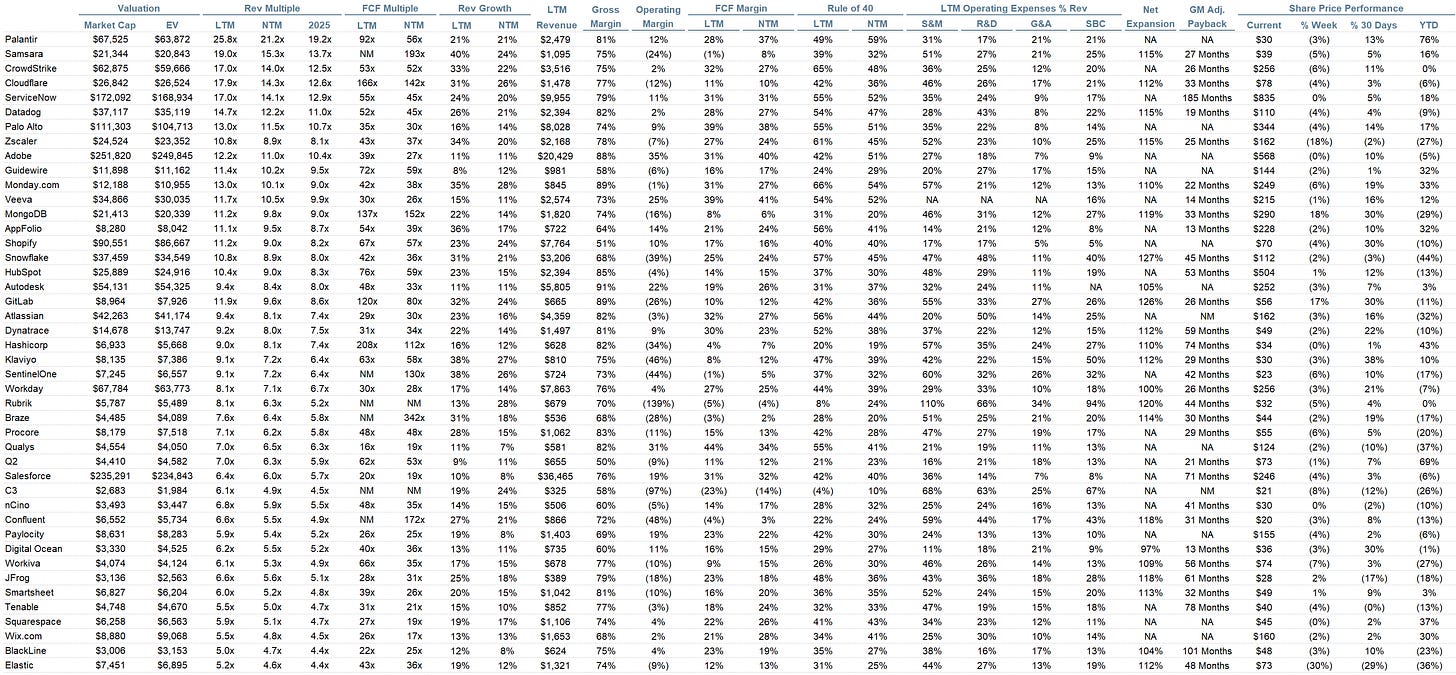
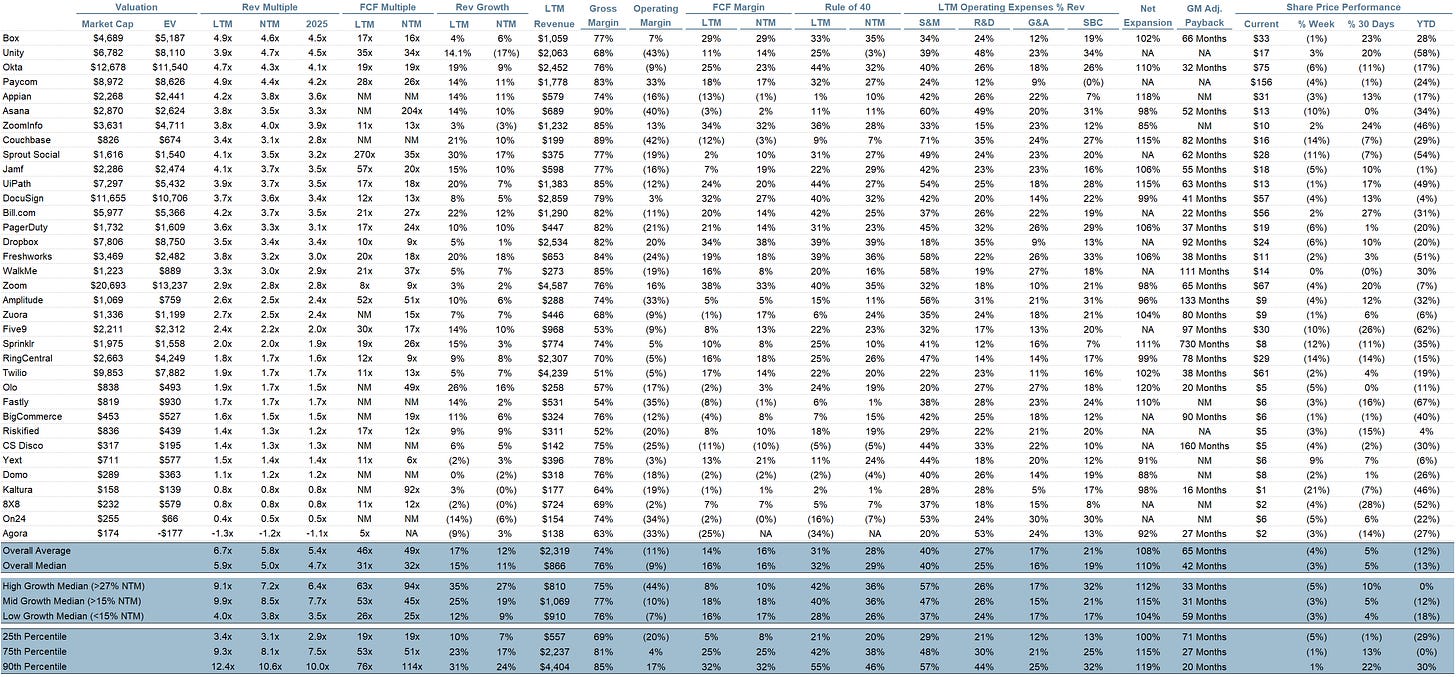
Comps Output
Rule of 40 shows rev growth + FCF margin (both LTM and NTM for growth + margins). FCF calculated as Cash Flow from Operations - Capital Expenditures
GM Adjusted Payback is calculated as: (Previous Q S&M) / (Net New ARR in Q x Gross Margin) x 12 . It shows the number of months it takes for a SaaS business to payback their fully burdened CAC on a gross profit basis. Most public companies don’t report net new ARR, so I’m taking an implied ARR metric (quarterly subscription revenue x 4). Net new ARR is simply the ARR of the current quarter, minus the ARR of the previous quarter. Companies that do not disclose subscription rev have been left out of the analysis and are listed as NA.
Sources used in this post include Bloomberg, Pitchbook and company filings
The information presented in this newsletter is the opinion of the author and does not necessarily reflect the view of any other person or entity, including Altimeter Capital Management, LP ("Altimeter"). The information provided is believed to be from reliable sources but no liability is accepted for any inaccuracies. This is for information purposes and should not be construed as an investment recommendation. Past performance is no guarantee of future performance. Altimeter is an investment adviser registered with the U.S. Securities and Exchange Commission. Registration does not imply a certain level of skill or training.
This post and the information presented are intended for informational purposes only. The views expressed herein are the author’s alone and do not constitute an offer to sell, or a recommendation to purchase, or a solicitation of an offer to buy, any security, nor a recommendation for any investment product or service. While certain information contained herein has been obtained from sources believed to be reliable, neither the author nor any of his employers or their affiliates have independently verified this information, and its accuracy and completeness cannot be guaranteed. Accordingly, no representation or warranty, express or implied, is made as to, and no reliance should be placed on, the fairness, accuracy, timeliness or completeness of this information. The author and all employers and their affiliated persons assume no liability for this information and no obligation to update the information or analysis contained herein in the future.


As always thanks for the great info. I have asked before but I will ask again- is it possible to get the Comps Output spreadsheet in Excel or Google Sheets? The data is great but with no way to sort it is hard to analyze. Also, what is your default method of sorting? The list is not alphabetical and I can't see it is sorted by any of the metrics. Thx!
really good article and way of putting it - thanks so much!! Great stuff, as always