DigitalOcean: Benchmarking the S-1 Data
DigitalOcean filed their initial S1 statement today. A S-1 is a document companies file with the SEC in preparation for listing their shares on an exchange like the NYSE or NASDAQ. The document contains a plethora of information on the company including a general overview, up to date financials, risk factors to the business, cap table highlights and much more. The purpose of the detailed information is to help investors (both institutional and retail) make informed investment decisions. There’s a lot of info to digest, so in the sections below I’ll try and pull out the relevant financial information and benchmark it against current cloud businesses. As far as an expected timeline - typically companies launch their roadshow ~3 weeks after filing their initial S-1 (the roadshow launches with an updated S-1 that contains a price range). After the roadshow launch there’s typically ~2 weeks before the stock starts trading. So we’re looking at roughly 5 weeks before any retail investor can buy the stock.
DigitalOcean Overview
From the S1 - “DigitalOcean is a leading cloud computing platform offering on-demand infrastructure and platform tools for developers, start-ups and small and medium-sized businesses, or SMBs. We were founded with the guiding principle that the transformative benefits of the cloud should be easy to leverage, broadly accessible, reliable and affordable. Our platform simplifies cloud computing, enabling our customers to rapidly accelerate innovation and increase their productivity and agility. Over 570,000 individual and business customers currently use our platform to build, deploy and scale software applications. Our users include software engineers, researchers, data scientists, system administrators, students and hobbyists. Our customers use our platform across numerous industry verticals and for a wide range of use cases, such as web and mobile applications, website hosting, e-commerce, media and gaming, personal web projects, and managed services, among many others. We believe that our focus on simplicity, community, open source and customer support are the four key differentiators of our business, driving a broad range of customers around the world to build their applications on our platform.”
Market Opportunity From the S-1 - “The Infrastructure-as-a-Service (IaaS) and Platform-as-a-Service (PaaS) markets are two of the largest and fastest growing markets across all industries. According to IDC, the worldwide IaaS and PaaS markets for individuals and companies with less than 500 employees are estimated to be approximately $44.4 billion in the aggregate in 2020. The 2020 IaaS market, which is comprised of compute and storage, was estimated to be $31.9 billion. The 2020 PaaS market, which includes database management systems, application platforms and other platform services, was estimated to be $12.5 billion. According to IDC, these combined IaaS and PaaS markets are expected to grow to $115.5 billion in 2024, representing a 27% compound annual growth rate.
We believe the individual developer, start-up and SMB markets are underserved, and we expect our massive addressable market to continue to grow rapidly beyond 2024. The key drivers of this growth come from the increasing technological innovation which drives cloud adoption combined with the growing number of developers and SMBs worldwide. According to SlashData, the global developer population is expected to more than double over the next 10 years to approximately 45 million by 2030. Furthermore, there are more than 32 million SMBs in the United States alone, according to the World Bank, and we estimate that there are at least three times that number, or 100 million SMBs, globally. We expect this number will continue to grow, with more than 14 million net new SMBs created globally each year.”
An Efficient Business Model
From the S-1: “We have a highly efficient self-service customer acquisition model, which we have recently complemented with a targeted inside sales force. Our sales and marketing expense as a percentage of revenue was approximately 14%, 12% and 11% in 2018, 2019 and 2020, respectively. The efficiency of our go-to-market model and our focus on the needs of the individual and SMB market have helped us build a global customer base that continues to grow. We had approximately 573,000 customers as of December 31, 2020, up from approximately 502,000 as of December 31, 2018.”
Benchmark Data
The data shown below depicts how the DigitalOcean data compares to the operating metrics of current public SaaS / Cloud businesses.
TLDR - DigitalOcean has decent scale (especially for an IPO), steady growth, low gross margins (but higher operating margins), and hyper efficient S&M spend / CAC payback
Last Twelve Months (LTM) Revenue
LTM revenue: $318M
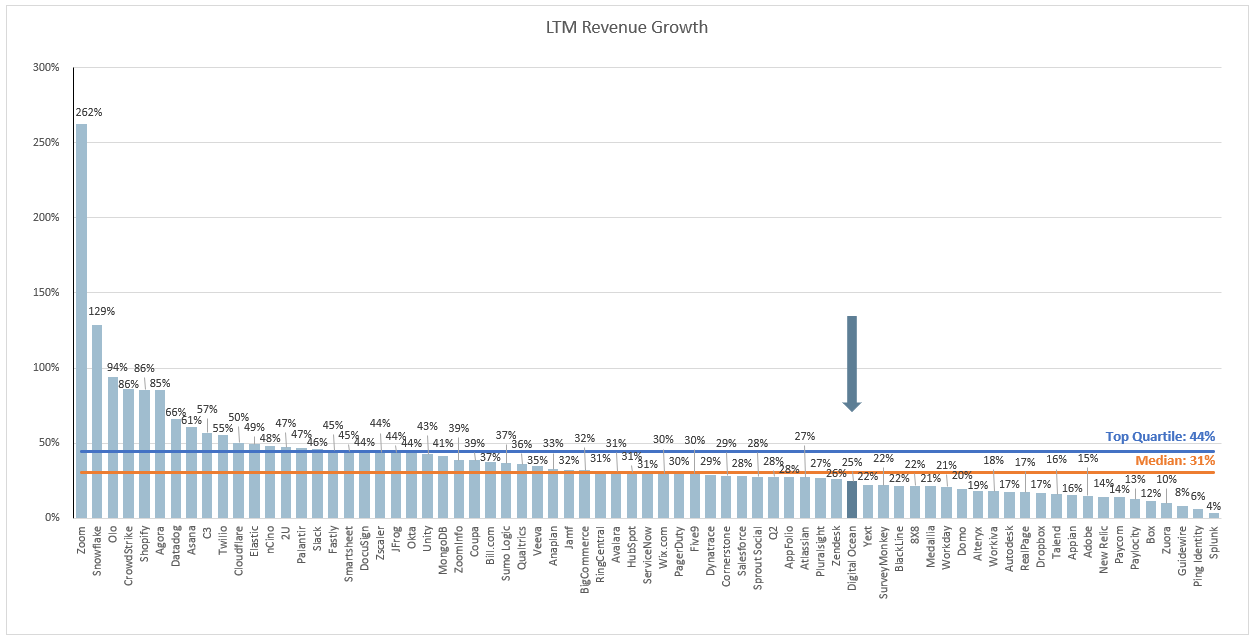
LTM Revenue Growth
LTM revenue growth: 25%
Quarterly YoY Revenue Growth Trends
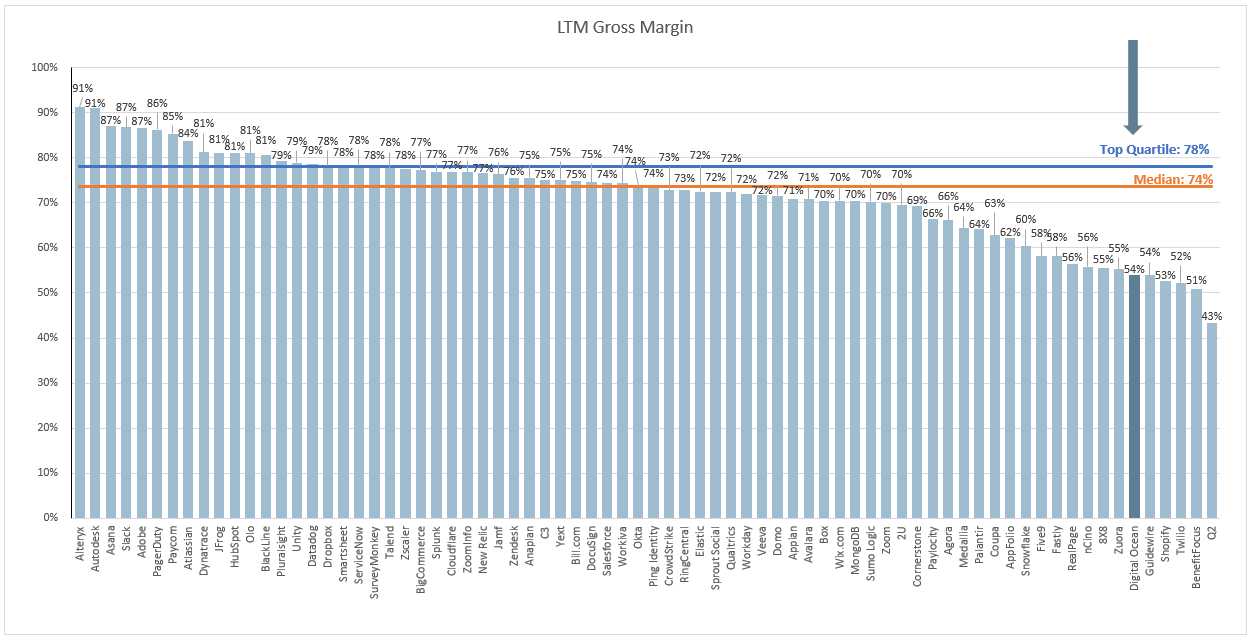
LTM GAAP Gross Margin
LTM Gross Margins: 54%
LTM GAAP Operating Margin
LTM GAAP Operating Margins: (5%)
Rule of 40
In the below chart I’m showing LTM revenue growth + LTM FCF margin.
DigitalOcean Rule of 40: 8%
Net Revenue Retention
This metric is calculated by taking the annual recurring revenue of a cohort of customers from 1 year ago, and comparing it to the current annual recurring revenue of that same set of customers (even if you experienced churn and that group of customers now only has 9, or anything <10).
Gross Margin Adjusted CAC Payback
(Previous Q S&M) / (Net New ARR x Gross Margin) x 12. This metric demonstrates how long it takes (in months) for a customer to pay back the cost at which it took to acquire them. In the chart below I’m taking the average of the 4 quarters leading up to IPO to remove any seasonality out outliers.
This post and the information presented are intended for informational purposes only. The views expressed herein are the author’s alone and do not constitute an offer to sell, or a recommendation to purchase, or a solicitation of an offer to buy, any security, nor a recommendation for any investment product or service. While certain information contained herein has been obtained from sources believed to be reliable, neither the author nor any of his employers or their affiliates have independently verified this information, and its accuracy and completeness cannot be guaranteed. Accordingly, no representation or warranty, express or implied, is made as to, and no reliance should be placed on, the fairness, accuracy, timeliness or completeness of this information. The author and all employers and their affiliated persons assume no liability for this information and no obligation to update the information or analysis contained herein in the future.


