
Figma - Benchmarking the S1 Data


Yesterday Figma filed their initial Form S-1 statement. I wrote about Figma back in Feb ‘21 for those looking for a more detailed breakdown of what the business looked like at the time (a lot has changed!).
A Form S-1 is a document companies file with the SEC in preparation for listing their shares on an exchange like the NYSE or NASDAQ. The document contains a plethora of information on the company including a general overview, up to date financials, risk factors to the business, cap table highlights and much more. The purpose of the detailed information is to help investors (both institutional and retail) make informed investment decisions. There’s a lot of info to digest, so in the sections below I’ll try and pull out the relevant financial information and benchmark it against current cloud businesses. As far as an expected timeline - typically companies launch their roadshow ~3 weeks after filing their initial S-1 (the roadshow launches with an updated S-1 that contains a price range). After the roadshow launch, there’s typically ~2 weeks before the stock starts trading. So we’re generally looking at roughly 5 weeks before any retail investor can buy the stock.
Figma Overview
From the S1 - “Figma is where teams come together to turn ideas into the world’s best digital products and experiences.
Every day, billions of people around the world use apps, websites, and other digital experiences that are made in Figma. They’re looking up directions on Google Maps; requesting rides with Uber; checking in for flights on JetBlue; streaming shows on Netflix; learning languages with Duolingo; asking questions of Claude; connecting on LinkedIn; buying goods on Mercado Libre; or booking stays and experiences with Airbnb.
Behind each of these products is a cross-functional team responsible for bringing them to life. In Figma, designers work alongside developers, product managers (“PMs”), researchers, marketers, writers, and other non-designers who, in the three months ended March 31, 2025, made up two-thirds of our more than 13 million monthly active users.1 Together, these teams share and explore ideas, align on a vision, visualize concepts, and translate them into coded products — all on a single, connected, AI-powered platform that collaborators around the world can access with a URL.”
Product Overview

From the S-1: “We are a platform for design and product development. And while the workflow of creating software and other digital products and experiences can take many paths and forms, the process has traditionally involved the following key phases:
Ideate and Align. The team comes together to brainstorm different solutions to user problems and align on a path forward. [My note: Their products here are FigJam and Figma Slides.]
Visualize. Designers, PMs, and others bring life to these ideas by visualizing them at different levels of fidelity, which starts to give a sense of how the overall experience comes together. [My note: Their products here are Figma Design and Figma Draw.]
Build. These ideas and visualizations are turned into code (most often by a developer) and made production-ready. [My note: Their product here is Dev Mode.]
Ship. The product is launched, so it can end up in users’ hands, and marketed, so more users adopt it; this kicks off a continuous loop of learning, refinement, and improvement.” [My note: Their products here are Figma Sites and Figma Buzz.]
Here’s some additional data on their products I mentioned above (all copy / pasted from the S1)
FigJam: “FigJam is our product tailored for ideation, brainstorming, and rapid communication of ideas. Designed for users of all skill levels, FigJam makes everything from personal projects to solo ideation to team meetings more engaging and fun. In FigJam, users can also use AI to generate templates for group brainstorms and summarize meeting notes in seconds.”
Figma Slides: “Figma Slides helps teams collaboratively make compelling, engaging presentations that drive and maintain alignment. What makes this product especially effective for product teams is the way it marries Figma’s powerful design features — such as the ability to embed prototypes, create high-fidelity animations, or make detailed edits to mock-ups directly in a slide — with strong real-time collaboration capabilities like seamless multiplayer editing and audience voting.”
Figma Design: “Figma Design offers a wide range of features that make it possible to visualize ideas with high fidelity, including typography features or vector editing capabilities that add texture and dimension to designs. In some cases, designers want to make more detailed, finer edits to key assets in their design, like icons and product illustrations.”
Figma Draw: “In some cases, designers want to make more detailed, finer edits to key assets in their design, like icons and product illustrations. For these users, we’ve created Figma Draw, which is a dedicated space for vector editing within Figma Design.”
Figma Dev Mode: “Once the designs are ready, it’s time to translate them into code. Dev Mode is our dedicated space for developers where this translation occurs, built to streamline the back and forth between design and engineering and reduce the miscommunication that often happens during this step. In Dev Mode, developers can inspect the designs to see key details most relevant to them, like special annotations left by designers, documentation about the components used, or what’s changed since they last saw the design.”
Figma Sites: “Figma Sites represents our first offering that ships a design directly to production, by allowing you to publish a design as a working website, with a URL of your choice, that anyone in the world can access. Figma Sites includes features that help make designs production-ready for the web, like breakpoints that make websites responsive across different window sizes and devices. It also supports the ability to augment designs with code (via a feature called code layers) to help make more powerful, dynamic experiences, like adding special motion effects or an interactive form, that would otherwise have been impossible to build with just a design tool.”
Figma Buzz: “Once a product has been shipped to production, the last step is to actually promote it, to ensure existing and prospective users are aware of the value of what’s launched. This is where Figma Buzz comes in — a tool that makes it easy to create on-brand marketing collateral, like social media assets, digital ads, and more.”
Figma Make: “We believe AI is fundamentally transforming the product development process by making it possible for anyone to quickly turn an idea into a functional prototype, or in some cases, a working product. Figma Make is our product for this new paradigm. Instead of going from idea to wireframe to mock-up to prototype iteratively, Figma Make lets users go directly from prompt to working prototype, at which point they can immediately validate an idea and choose to iterate on it, or discard it altogether. Like Figma Sites, what’s created in Figma Make — whether it is a dynamic prototype or web app — can be published to a URL for anyone to use.”
Market Opportunity
From the S-1: “We estimate that our total addressable market is $33 billion today across the “global workforce engaged in software design,” as identified by IDC. We calculate our total addressable market based on internal Figma data and the IDC Executive Spotlight sponsored by Figma, “Global Workforce Engaged in Software Design Expands to 144 Million by 2029.” We commissioned this IDC Executive Spotlight, which sizes the global number of participants involved in the product development process.” [To estimate our market opportunity, we took IDC primary research-informed models of the global workforce population engaged in software design and then applied our internal pricing data to determine our total addressable market.]
How Figma Makes Money
From the S-1: “Our subscription model is designed to meet the diverse and evolving needs of our growing community and customer base. Access to Figma is sold as an annual or monthly subscription, per seat. Everyone from independent freelancers to entire product teams at Fortune 500 companies design and build products and digital experiences in Figma. We offer different seats and plans tailored to the specific security, product, and administrative needs of different users, organizations, and industries.
Our plans range from a more limited free offering to more advanced plans built in partnership with our customers that meet the specific needs of the larger organizations using our platform. [My note: these plans include starter, professional, organization and enterprise] . . .

“Rather than a one-size-fits all approach, we offer different seats tailored to specific user needs and workflows. At the same time, we also see roles continuing to blur as the product-development process keeps evolving.” [My note: these seats include viewer, collab, content, dev and full] . . .

Benchmark Data
The data shown below depicts how the Figma data compares to the operating metrics of current public SaaS businesses.
Last Twelve Months (LTM) Revenue
Figma’s LTM revenue was $821m

LTM Revenue Growth
Figma’s LTM revenue growth was 49%

Quarterly YoY Revenue Growth Trends
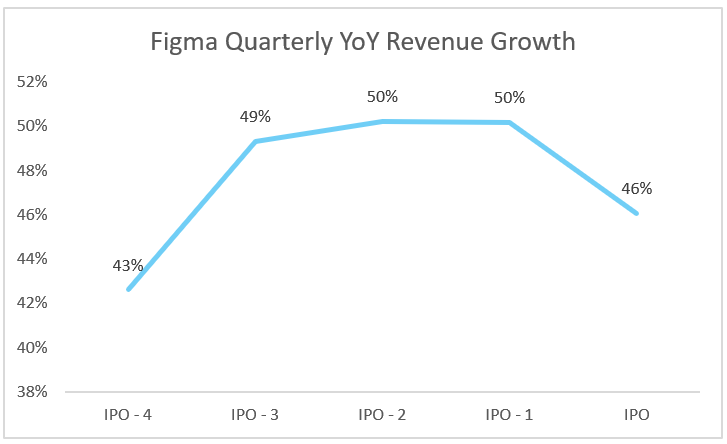
LTM GAAP Gross Margin
Figma’s LTM gross margins were 89%.

LTM GAAP Operating Margin
Figma’s as-reported LTM operating margin was (94%). BUT, in my opinion, this number doesn’t tell the whole story. After the Adobe acquisition fell apart, the company did a large tender (that triggered quite a large one-time SBC expense). In the S-1, they disclosed they disclosed the one-time expenses related to both the failed Adobe transaction, as well as the one-time costs associated with the transaction (things like banker fees, taxes on the breakup fee, etc). To calculate my “adjusted” LTM operating margin I’m just backing that out. On page 135 of the S1 they break out these specific costs so you can see what went into the calculation. The adjusted operating margin (which I think is more apples to apples with the peer set of public comps) was 18%.

LTM FCF Margin
Figma had a 28% LTM FCF margin. Similar to the operating margin, there are one-time costs associated with the Adobe transaction that I’m adding back to their FCF. Namely, they received a $1b break-up fee from Adobe, but had to pay ~$180m of taxes on the breakup fee. That doesn’t feel like it should be included in their FCF so I’m adding it back.

Net Revenue Retention
This metric is calculated by taking the annual recurring revenue of a cohort of customers from 1 year ago, and comparing it to the current annual recurring revenue of that same set of customers (even if you experienced churn and that group of customers now only has 9, or anything <10).

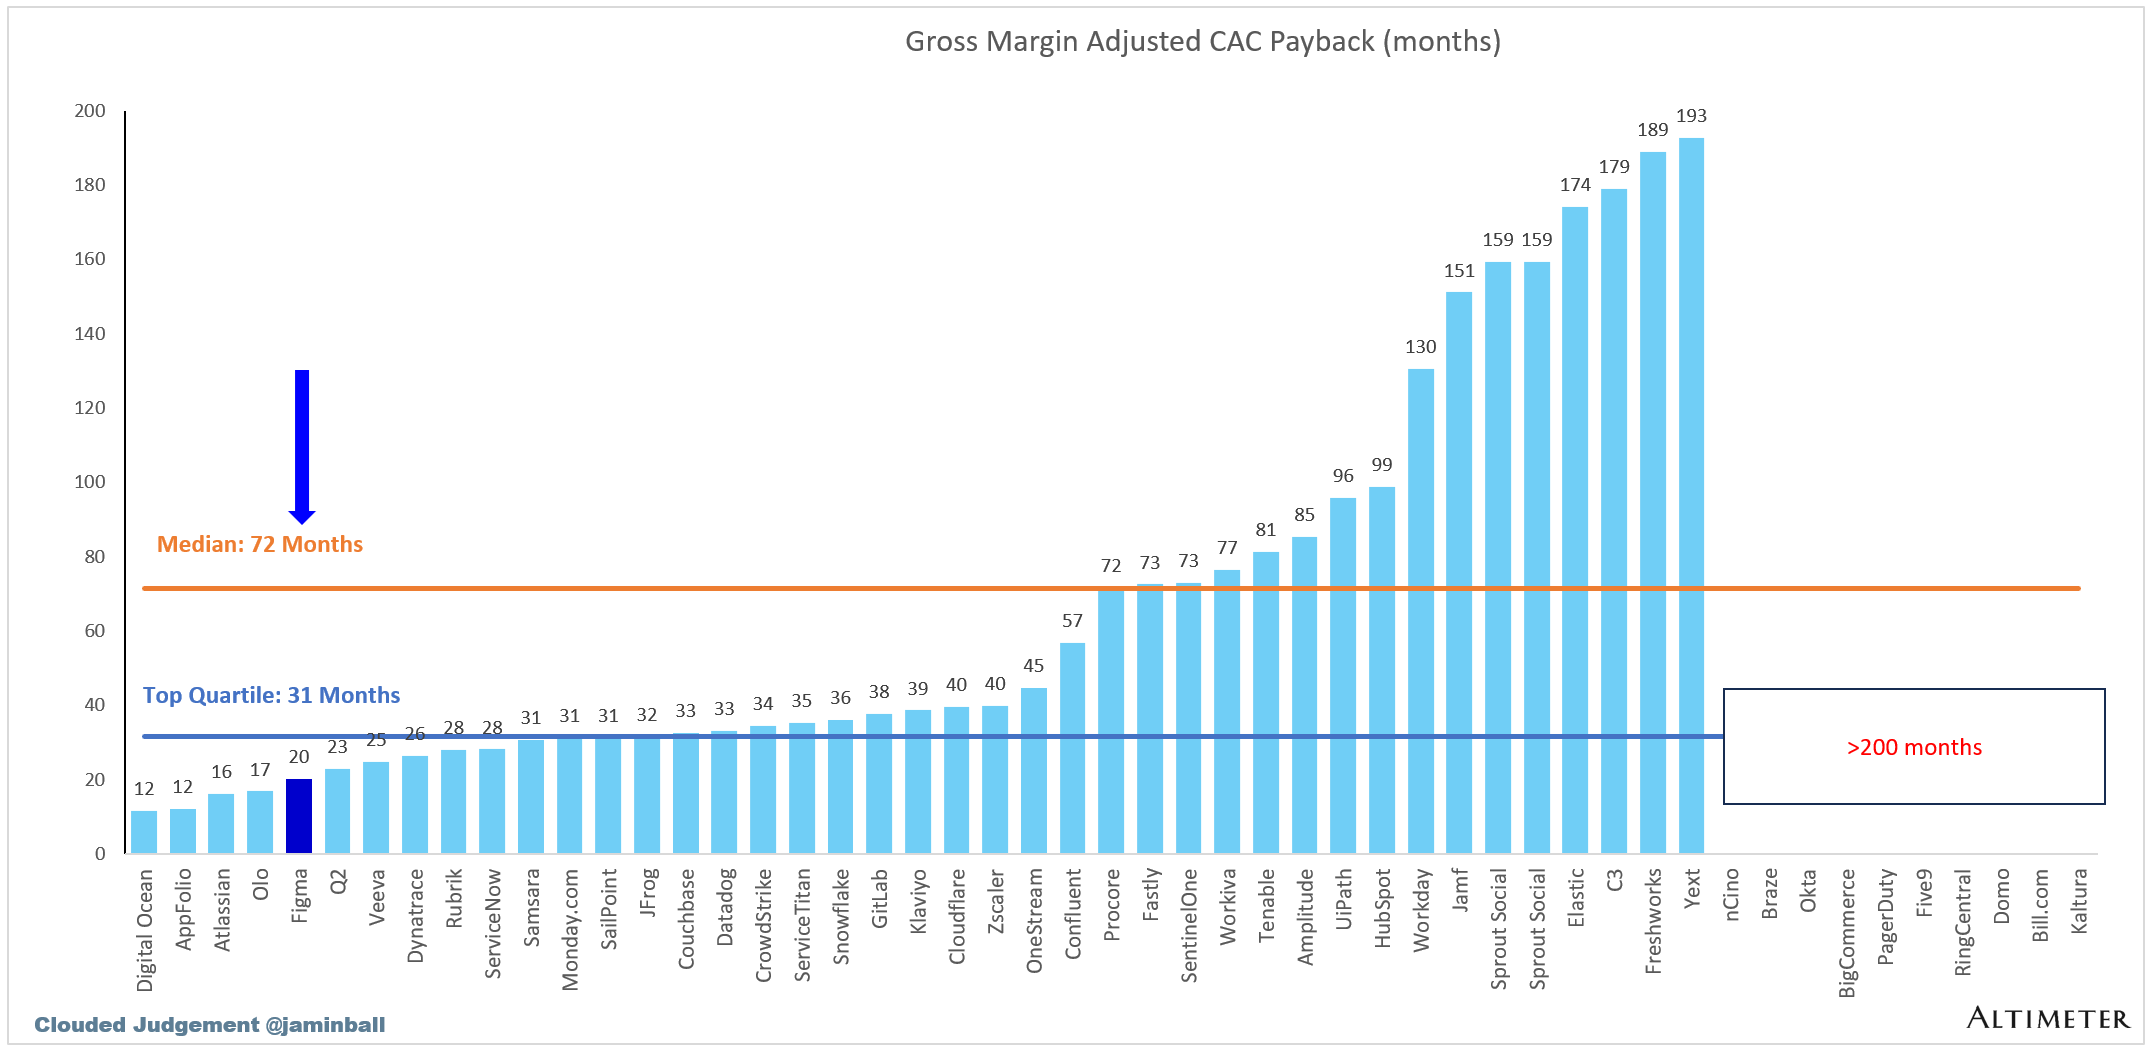
Gross Margin Adjusted CAC Payback
(Previous Q S&M) / (Net New ARR x Gross Margin) x 12. This metric demonstrates how long it takes (in months) for a customer to pay back the cost at which it took to acquire them.
LTM S&M Expense as % of LTM Revenue
For Figma I’m showing the last 9 months (last 3 quarters) of S&M as a % of revenue. Like the operating margin, the GAAP S&M expenses doesn’t tell the full story due to the large tender offer post the Adobe acquisition falling apart (in Q2 ‘24). I think it’s a lot more apples to apples (and in my opinion gives a more accurate portrayal of the business) to exclude that month when comparing to the rest of the software universe.

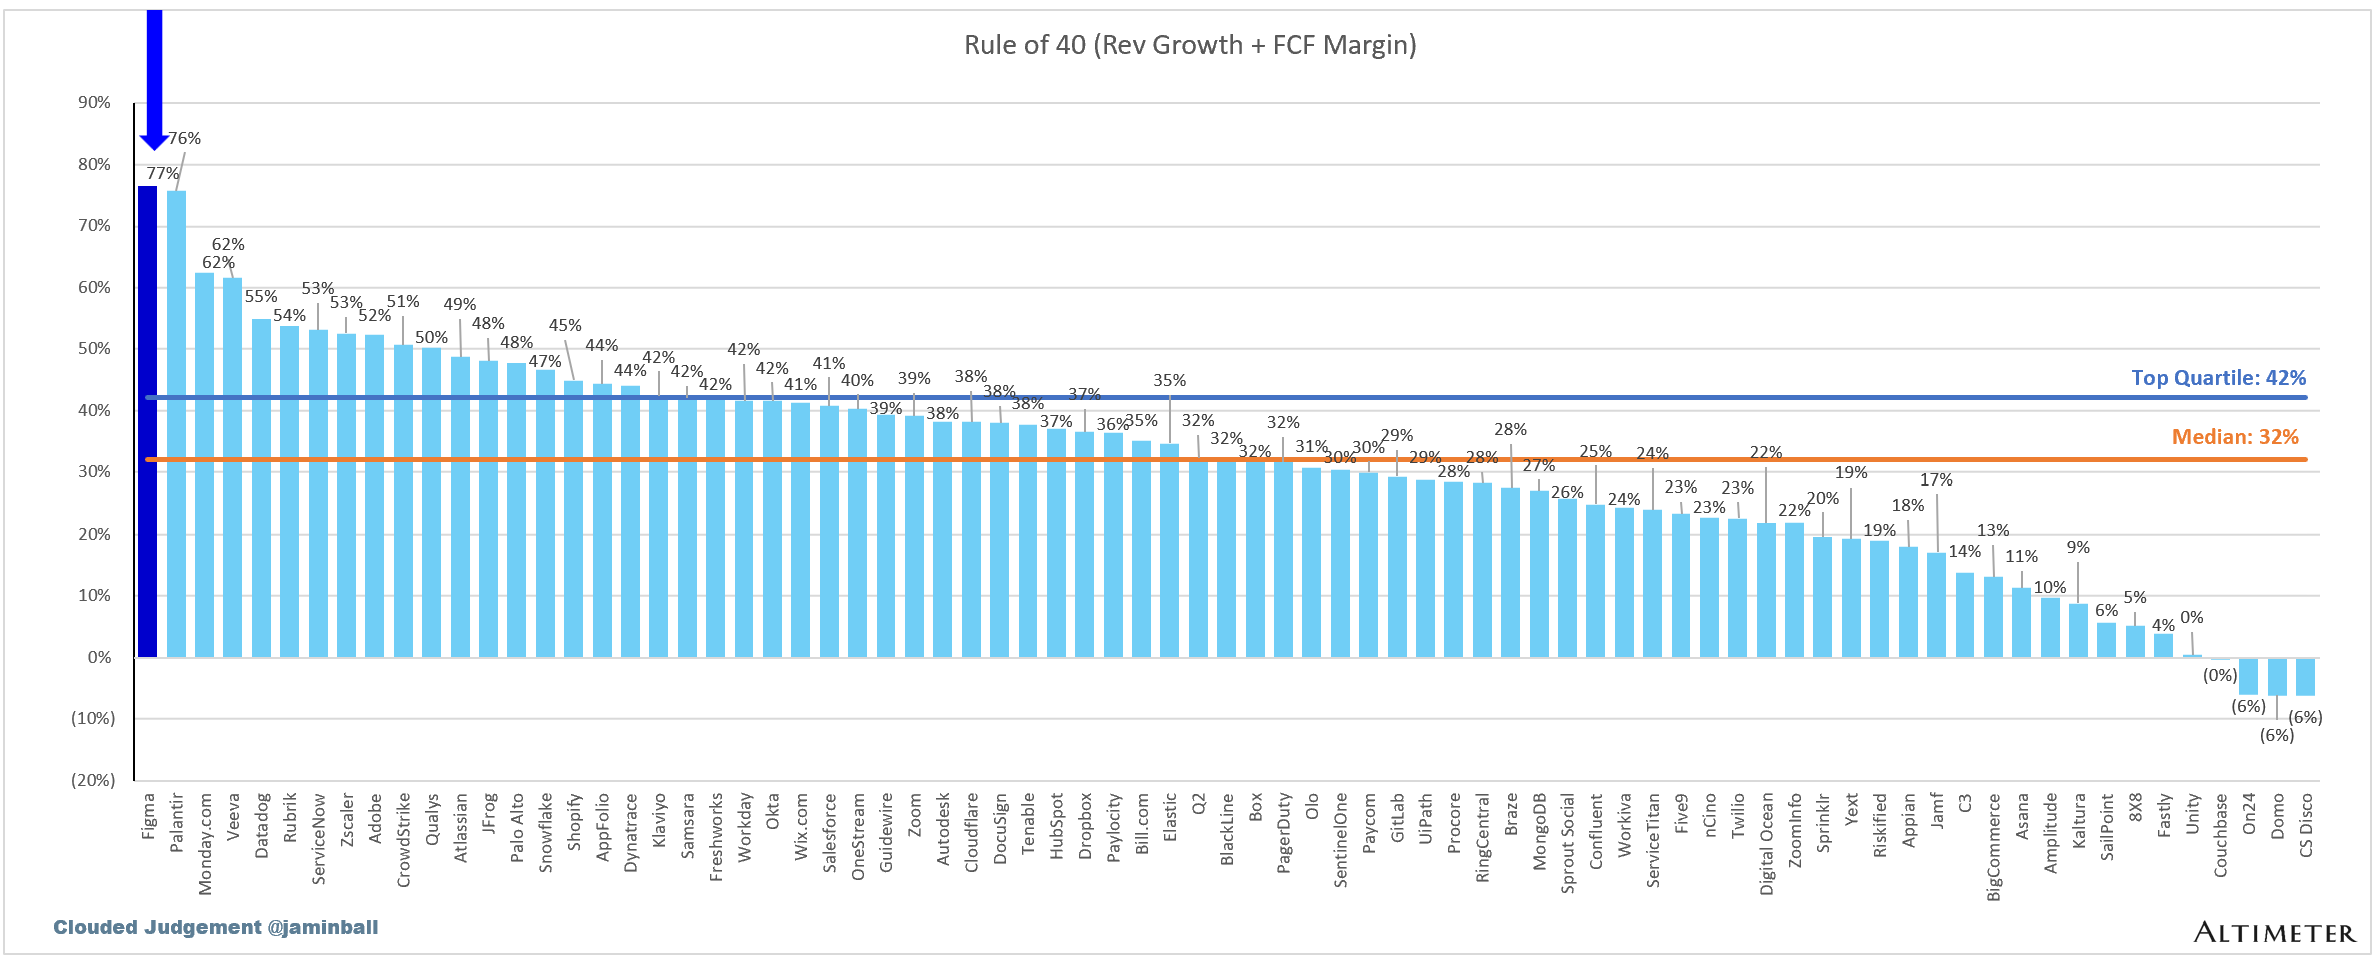
Rule of 40
In the below chart I’m showing LTM revenue growth + LTM FCF margin.
The information presented in this newsletter is the opinion of the author and does not necessarily reflect the view of any other person or entity, including Altimeter Capital Management, LP ("Altimeter"). The information provided is believed to be from reliable sources but no liability is accepted for any inaccuracies. This is for informational purposes and should not be construed as an investment recommendation or legal advice. Past performance is no guarantee of future performance. Altimeter is an investment adviser registered with the U.S. Securities and Exchange Commission. Registration does not imply a certain level of skill or training. Altimeter and its clients trade in public securities and have made and/or may make investments in or investment decisions relating to the companies referenced herein. The views expressed herein are those of the author and not of Altimeter or its clients, which reserve the right to make investment decisions or engage in trading activity that would be (or could be construed as) consistent and/or inconsistent with the views expressed herein.
This post and the information presented are intended for informational purposes only. The views expressed herein are the author’s alone and do not constitute an offer to sell, or a recommendation to purchase, or a solicitation of an offer to buy, any security, nor a recommendation for any investment product or service or legal advice. While certain information contained herein has been obtained from sources believed to be reliable, neither the author nor any of his employers or their affiliates have independently verified this information, and its accuracy and completeness cannot be guaranteed. Accordingly, no representation or warranty, express or implied, is made as to, and no reliance should be placed on, the fairness, accuracy, timeliness or completeness of this information. The author and all employers and their affiliated persons assume no liability for this information and no obligation to update the information or analysis contained herein in the future.
Are those CAC payback numbers correct? It takes Workday 10 years to payback their customer acquisition costs?
Great details. Thanks