Recently OneStream their initial S1 statement. A S-1 is a document companies file with the SEC in preparation for listing their shares on an exchange like the NYSE or NASDAQ. The document contains a plethora of information on the company including a general overview, up to date financials, risk factors to the business, cap table highlights and much more. The purpose of the detailed information is to help investors (both institutional and retail) make informed investment decisions. There’s a lot of info to digest, so in the sections below I’ll try and pull out the relevant financial information and benchmark it against current cloud businesses. As far as an expected timeline - yesterday the company filed an amended S-1 with a $17 - $19 price range (more on that in a minute). We can expect the company to start trading on the public markets next Wednesday
OneStream Overview
From the S1 - “OneStream delivers a unified, AI-enabled and extensible software platform—the Digital Finance Cloud—that modernizes and increases the strategic impact of the Office of the CFO. Our platform unifies core financial and broader operational data and processes within a single platform, with solutions that maintain the integrity of corporate reporting standards for Finance while providing operationally significant insights for business users. With embedded applied AI and machine learning technologies built specifically for Finance, our platform automates and streamlines workflows, accelerates analysis and improves forecast accuracy, equipping the Office of the CFO to report on, predict and guide business performance. Our platform’s extensible architecture also enables customers to rapidly adopt and develop new solutions that meet the unique and continually evolving needs of their business. The Digital Finance Cloud empowers the Office of the CFO to form a comprehensive, dynamic and predictive view of the entire enterprise, providing corporate leaders the control, visibility and agility required to proactively adjust business strategy and day-to-day execution.”
Product Overview
From the S-1: “Our unified platform’s highly differentiated capabilities enable us to deliver a comprehensive set of solutions for the Office of the CFO that eliminates the need for our customers to use multiple disparate legacy products, applications and modules. Our solutions include the following:
Financial Close and Consolidation. Streamlines financial processes with advanced capabilities designed to automate tasks and manage the immense complexity and strict standards of financial reporting and consolidation.
Financial and Operational Planning and Analysis. Enables financial and operational planning, budgeting, forecasting and results analysis for individual business functions and the synchronization of those plans across the entire organization.
Financial and Operational Reporting. Provides end-to-end visibility of analytics and key metrics to all stakeholders, including executives, Finance professionals, line-of-business leaders and other business partners.
In addition to our financial and operational capabilities, the Digital Finance Cloud embeds powerful applied AI and machine learning technologies to further enhance our offering to customers. Our Finance-specific AI and machine learning engines are built directly on our unified data model, ensuring seamless integration with our Finance solutions. With end-to-end data management and intuitive pre-built machine learning processes, our applied AI and machine learning engines empower Finance and operations teams to make informed business decisions and forecast with great speed and accuracy in today’s highly complex modern business environment.”
Market Opportunity
From the S-1: “We believe that transforming the Office of the CFO into a key driver of strategy and execution is critical for many organizations operating in today’s highly complex and constantly changing business environment. We estimate our total addressable market opportunity across all enterprises and mid-market organizations to be approximately $50 billion as of December 31, 2023. Our cloud-based platform enables a modern and expanded approach to finance and EPM, which is sometimes also referred to as corporate performance management, or CPM. As such, we believe we are well-positioned relative to our competitors to take advantage of this opportunity.”
How OneStream Makes Money
From the S-1: “Our business model centers on maximizing the lifetime value of a customer relationship. We recognize revenue from our SaaS contracts ratably over the term of the subscription period, which is typically three years but can range from less than one year up to ten years. We recognize the majority of the revenue from our term-based and perpetual licenses when our software is first made available to the customer or upon commencement of the license term, if later, and the remainder is attributable to maintenance and support fees recognized ratably over the contract term. In general, customer acquisition costs and other upfront costs associated with acquiring new customers are much higher in the first year of the contract, though sales commissions allocated to customer maintenance and support are amortized over a five-year period. For 2022 and 2023, our customer acquisition cost payback period, which is the average number of months required to fully recoup the customer acquisition cost in the relevant reporting period, was 21.3 months and 23.4 months, respectively. Over the lifetime of the customer relationship, we also incur sales and marketing costs related to upselling and expanding the number of users accessing our platform. However, these costs, as a percentage of revenue, are significantly less than those initially incurred to acquire the customer. As a result, the profitability of a customer to our business in any particular period depends in part on how long a customer has been a subscriber and the degree to which it has expanded the number of users of our platform.”
Implied Valuation
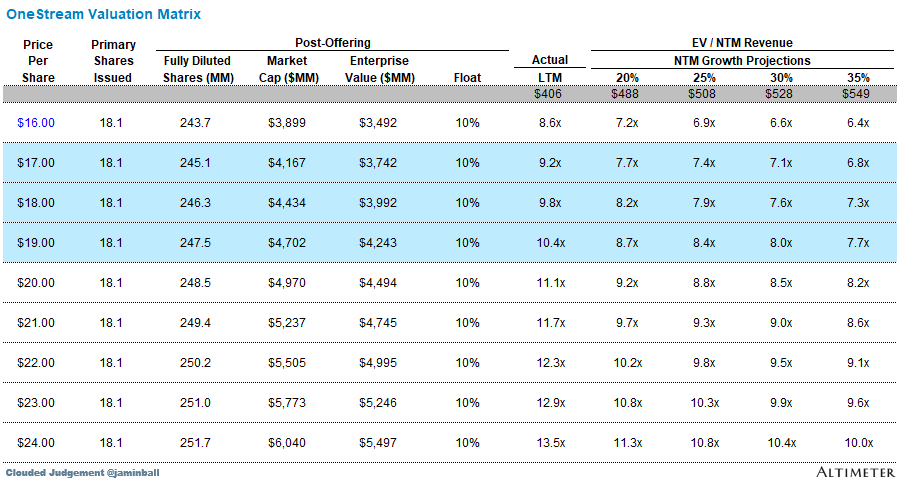
OneStream filed with an initial range of $17 - $19 / share. This implies roughly a $4.2 - $4.8b market cap, and a ~7.5x NTM revenue multiple. You can some metrics below based on different share prices. For additional context on the right hand side of the chart (estimated multiples), OneStream grew revenue 37% over the last 12 months, and 40% YoY in the last quarter. ARR grew 34% YoY in the most recent quarter
Benchmark Data
The data shown below depicts how the OneStream data compares to the operating metrics of current public SaaS businesses.
Last Twelve Months (LTM) Revenue
OneStream LTM revenue is $406m
LTM Revenue Growth
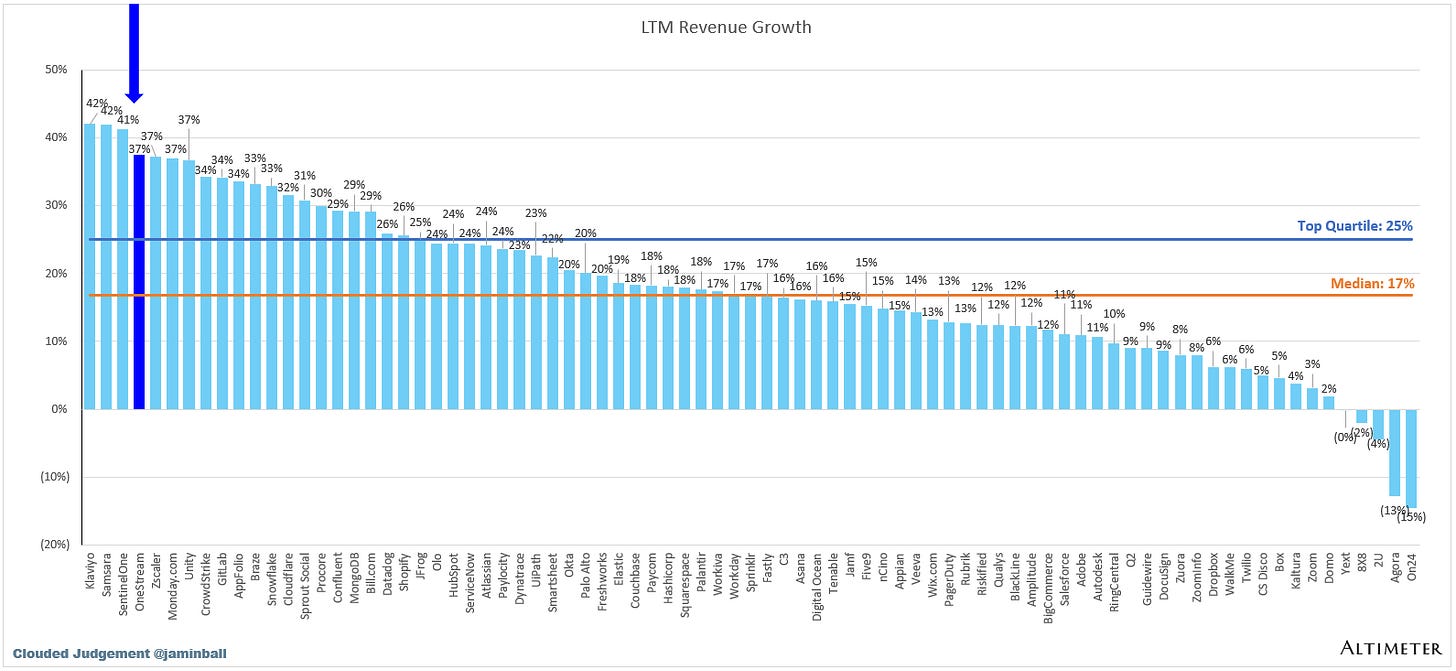
OneStream grew 37% over the last 12 months, making it one of the fastest growing public software companies.
Quarterly YoY ARR Growth Trends
LTM GAAP Gross Margin
OneStream has 70% LTM gross margins
LTM GAAP Operating Margin
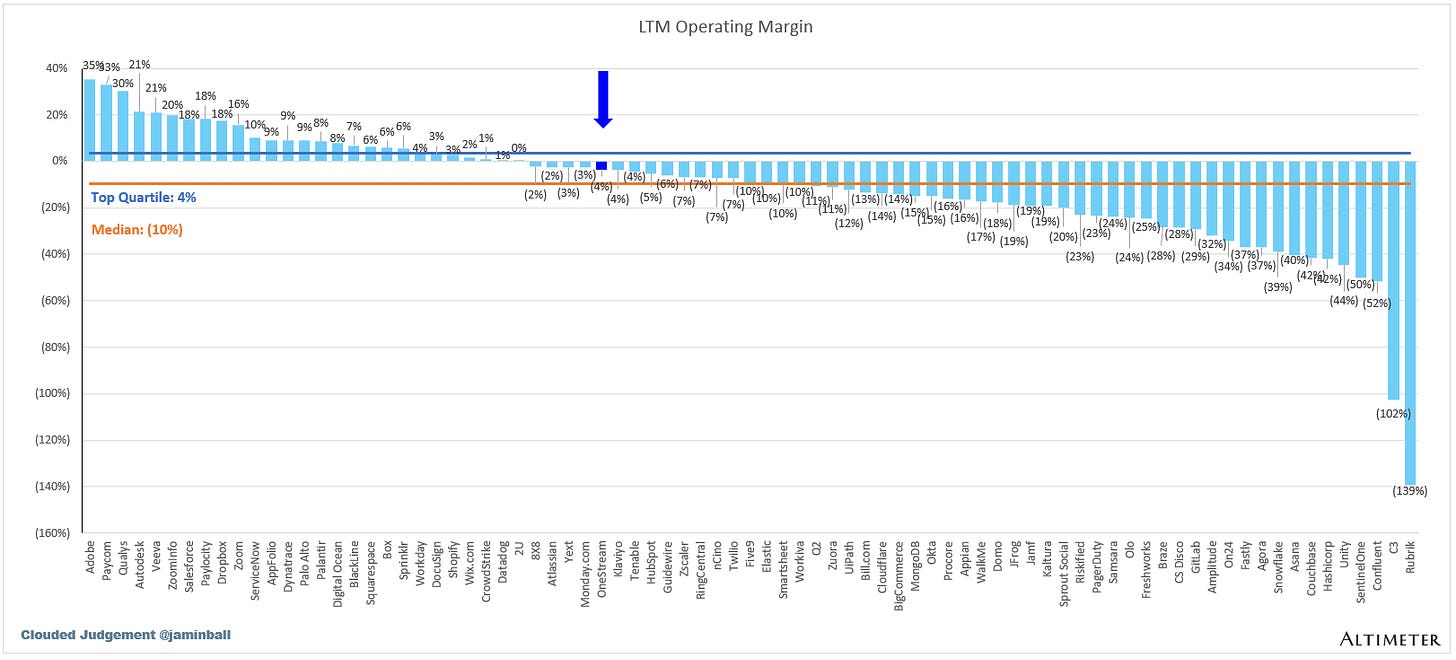
OneStream had (4%) operating margins over the LTM
LTM FCF Margin
OneStream had 11% FCF margins over the LTM
Net Revenue Retention
This metric is calculated by taking the annual recurring revenue of a cohort of customers from 1 year ago, and comparing it to the current annual recurring revenue of that same set of customers (even if you experienced churn and that group of customers now only has 9, or anything <10). Not all companies calculate it exactly the same
Gross Margin Adjusted CAC Payback
(Previous Q S&M) / (Net New ARR x Gross Margin) x 12. This metric demonstrates how long it takes (in months) for a customer to pay back the cost at which it took to acquire them. For OneStream I’m showing the average payback of the last 4 quarters
LTM S&M Expense as % of LTM Revenue
Rule of 40
In the below chart I’m showing LTM revenue growth + LTM FCF margin.
This post and the information presented are intended for informational purposes only. The views expressed herein are the author’s alone and do not constitute an offer to sell, or a recommendation to purchase, or a solicitation of an offer to buy, any security, nor a recommendation for any investment product or service. While certain information contained herein has been obtained from sources believed to be reliable, neither the author nor any of his employers or their affiliates have independently verified this information, and its accuracy and completeness cannot be guaranteed. Accordingly, no representation or warranty, express or implied, is made as to, and no reliance should be placed on, the fairness, accuracy, timeliness or completeness of this information. The author and all employers and their affiliated persons assume no liability for this information and no obligation to update the information or analysis contained herein in the future.


