Procore: Benchmarking the S-1 Data
Last week Procore filed an updated S-1 statement. They originally filed in February 2020, but put their IPO plans on hold when Covid hit. A S-1 is a document companies file with the SEC in preparation for listing their shares on an exchange like the NYSE or NASDAQ. The document contains information on the company including a general overview, up to date financials, market sizing estimates, risk factors to the business, cap table highlights and much more. The purpose of the detailed information is to help investors (both institutional and retail) make informed investment decisions. There’s a lot of info to digest, so in the sections below I’ll try and pull out the relevant financial information and benchmark it against current cloud businesses. As far as an expected timeline - typically companies launch their roadshow ~3 weeks after filing their initial S-1 (the roadshow launches with an updated S-1 that contains a price range). After the roadshow launch there’s typically ~2 weeks before the stock starts trading. So we’re looking at roughly 5 weeks before any retail investor can buy the stock.
Procore Overview
From the S1 - “We are a leading provider of cloud-based construction management software, and are helping transform one of the oldest, largest, and least digitized industries in the world. We focus exclusively on construction, connecting and empowering the industry’s key stakeholders, such as owners, general contractors, specialty contractors, architects, and engineers, to collaborate from any location, on any internet-connected device. Our platform is modernizing and digitizing construction management by enabling real-time access to critical project information, simplifying complex workflows, and facilitating seamless communication among key stakeholders, all of which we believe positions us to serve as the system of record for the construction industry. Adoption of our platform helps customers increase productivity and efficiency, reduce rework and costly delays, improve safety and compliance, and enhance financial transparency and accountability.”
Product Overview
From the S-1: “We offer these industry-transforming capabilities through an integrated, user-centric platform that features four product categories, our extensive App Marketplace, our proprietary data and analytics layer, and a powerful range of shared technical services leveraged across our products. The 4 product categories include:
Preconstruction. Our Preconstruction products facilitate collaboration between internal and external stakeholders during the planning, budgeting, estimating, bidding, and partner selection phase of a construction project.
Project Management. Our Project Management products connect entire construction project teams by ensuring project information is aggregated in a cloud-based platform, available to all project participants, and accurate so that work on the jobsite is completed correctly.
Resource Management. Our Resource Management product helps customers track labor productivity and manage profitability on construction projects.
Financial Management. Our Financial Management products provide customers with visibility into the financial health of their individual construction projects and portfolios and facilitate untethered access to financial data, linking the field and the office in real-time.”
Market Opportunity
From the S-1: “We believe that the current total addressable market, or TAM, for construction software is large and significantly underpenetrated. McKinsey estimates that annual worldwide construction revenue in 2017 was approximately $10 trillion. Separately, Deloitte estimates that in 2018, approximately 1.7% of worldwide construction and infrastructure revenue was spent on IT solutions. Furthermore, Gartner estimates that in 2018, application software spending represented 6.1% of total IT spend, calculated as application software spend divided by total IT spend across all industries. We therefore estimate that the construction industry spends approximately $10.4 billion worldwide annually on application software. We estimate that the annual potential market opportunity for our current products is approximately $9.4 billion. We calculate this figure by multiplying an estimate of the number of total owner, general contractor, and specialty contractor companies in our addressable geographies, as reported in a February 2021 Frost & Sullivan study that we commissioned, by our median ARR as of December 31, 2020, for each company size (categorized by enterprise, mid-market, and small business). ”
How Procore Makes Money
From the S-1: “We generate substantially all of our revenue from subscriptions to access our products and have an unlimited user model that is designed to facilitate adoption and maximize usage of our platform by all project stakeholders. We sell our products on a subscription basis for a fixed fee with pricing generally based on the number and mix of products and the annual construction volume contracted to run on our platform. As our customers subscribe to additional products, or increase the annual construction volume contracted to run on our platform, we generate more revenue.”
Procore’s average contract value (ACV) is $43k across their 10,166 customers.
Benchmark Data
The data shown below depicts how the Procore financials compare to the operating metrics of current public SaaS businesses.
Last Twelve Months (LTM) Revenue
Procore’s LTM revenue was $400M. Below the median of all public SaaS businesses, but on the larger side for an IPO
LTM Revenue Growth
Procore grew 38% over the last twelve months
Quarterly YoY Revenue Growth Trends
LTM GAAP Gross Margin
Procore has exceptional gross margins of 82%
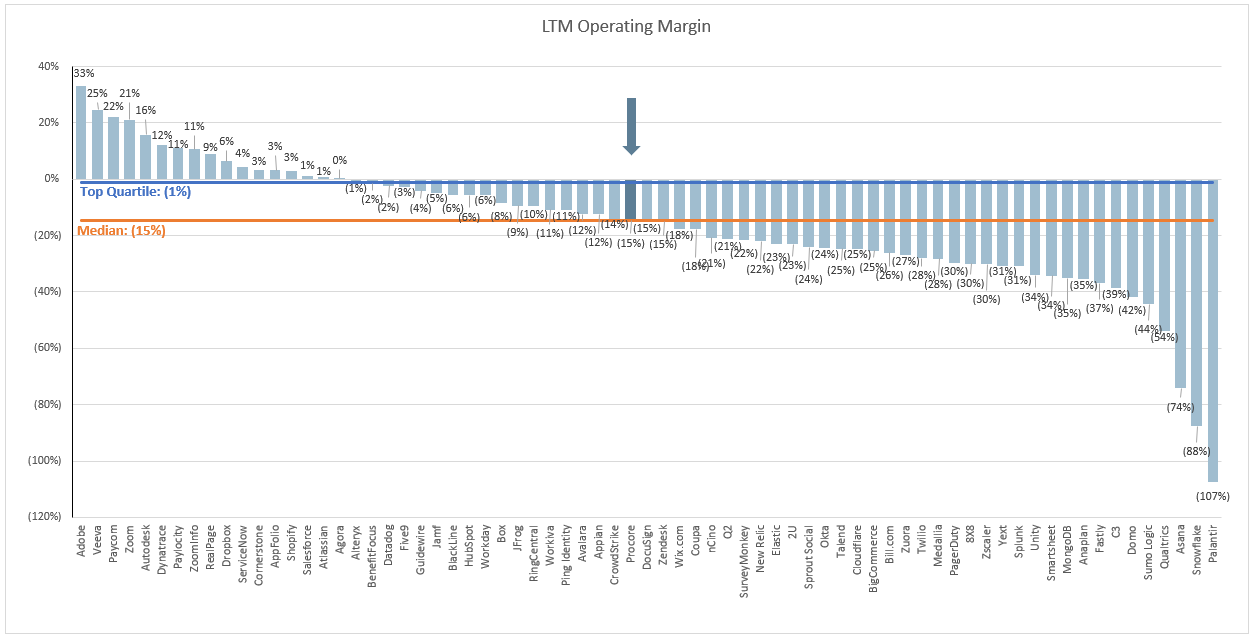
LTM GAAP Operating Margin
Procore LTM GAAP operating margin was (15%)
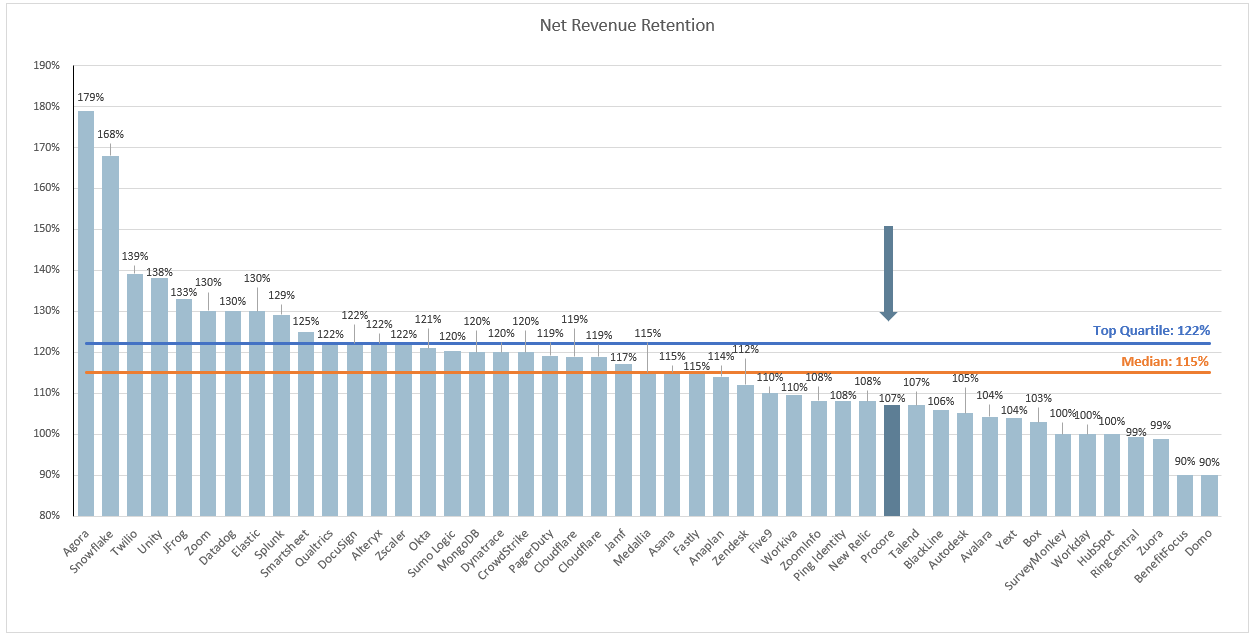
Net Revenue Retention
This metric is calculated by taking the annual recurring revenue of a cohort of customers from 1 year ago, and comparing it to the current annual recurring revenue of that same set of customers (even if you experienced churn and that group of customers now only has 9, or anything <10).
One note on Procore’s net retention - in 2018 net retention was 121% and in 2019 it was 117%. Their net retention declined over 2020 as a result of Covid. In their S-1 they stated: “Many of our customers saw their annual construction volumes slow in growth, stall, or decline as a result of the COVID-19 pandemic, meaning that they needed to run less construction volume on our platform than they otherwise would have. This limited contract expansion and in some cases created a reduction in contract value at renewal, impacting our net retention.”
Gross Margin Adjusted CAC Payback
(Previous Q S&M) / (Net New ARR x Gross Margin) x 12. This metric demonstrates how long it takes (in months) for a customer to pay back the cost at which it took to acquire them. In the chart below I’m taking the average of the 4 quarters leading up to IPO for Procore to normalize the business over the last year. Procore’s average CAC payback over the alts 4 quarters was 29 months.
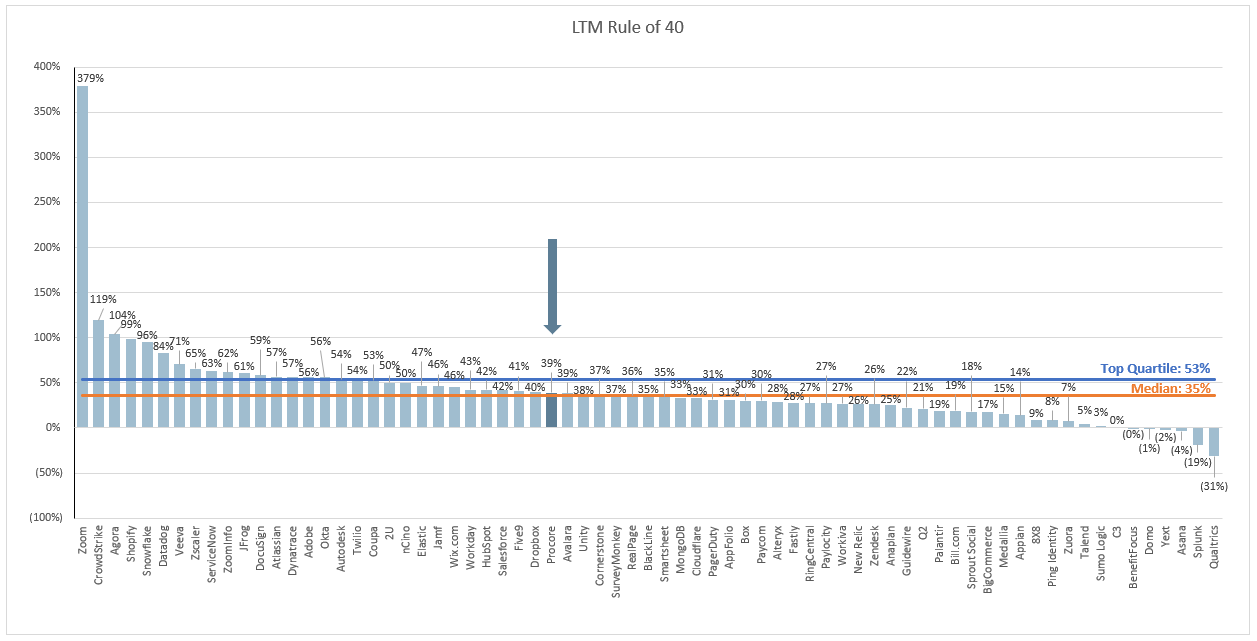
Rule of 40
In the below chart I’m showing LTM revenue growth + LTM FCF margin. Procore sits right above the median at 39%
This post and the information presented are intended for informational purposes only. The views expressed herein are the author’s alone and do not constitute an offer to sell, or a recommendation to purchase, or a solicitation of an offer to buy, any security, nor a recommendation for any investment product or service. While certain information contained herein has been obtained from sources believed to be reliable, neither the author nor any of his employers or their affiliates have independently verified this information, and its accuracy and completeness cannot be guaranteed. Accordingly, no representation or warranty, express or implied, is made as to, and no reliance should be placed on, the fairness, accuracy, timeliness or completeness of this information. The author and all employers and their affiliated persons assume no liability for this information and no obligation to update the information or analysis contained herein in the future.


Procure is a marketing and sales machine that pushes legacy software. They say the solve for the entire industry, but that is absolutely false. They solve for a GC and they actually hurt the industry from moving forward to a more data centric approach.