Samsara: Benchmarking the S-1 Data
Last week Samsara filed their initial S1 statement. A S-1 is a document companies file with the SEC in preparation for listing their shares on an exchange like the NYSE or NASDAQ. The document contains a plethora of information on the company including a general overview, up to date financials, risk factors to the business, cap table highlights and much more. The purpose of the detailed information is to help investors (both institutional and retail) make informed investment decisions. There’s a lot of info to digest, so in the sections below I’ll try and pull out the relevant financial information and benchmark it against current cloud businesses. As far as an expected timeline - typically companies launch their roadshow ~3 weeks after filing their initial S-1 (the roadshow launches with an updated S-1 that contains a price range). After the roadshow launch there’s typically ~2 weeks before the stock starts trading. So we’re looking at roughly 5 weeks before any retail investor can buy the stock.
Samsara Overview
From the S1 - “Samsara is on a mission to increase the safety, efficiency and sustainability of the operations that power the global economy. o realize this vision, we pioneered the Connected Operations Cloud, which allows businesses that depend on physical operations to harness Internet of Things (IoT) data to develop actionable business insights and improve their operations…Our Connected Operations Cloud consolidates data from our IoT devices and a growing ecosystem of connected assets and third-party systems, and makes it easy for organizations to access, analyze and act on data insights, using our cloud dashboard, custom alerts and reports, mobile apps and workflows. Our differentiated, purpose-built suite of solutions enables organizations to embrace and deploy a digital, cloud-connected strategy across their operations. With Samsara, customers have the ability to drive safer operations, increase business efficiency, and achieve their sustainability goals, all to improve the lives of their employees and the customers they serve.”
Product Overview
From the S-1: “Our Connected Operations Cloud includes:
Our Data Platform, which ingests, aggregates and enriches data from our IoT devices and a growing ecosystem of connected assets and third-party systems, and which has embedded capabilities for AI, workflows and analytics, alerts, API connections, and data security and privacy; and
Applications for video-based safety, vehicle telematics, apps and driver workflows, equipment monitoring, and site visibility
Our core Applications for connected fleets include:
Video-Based Safety: Enables customers to protect their teams with AI-enabled video, detecting high-risk behaviors and incidents in real-time, preserving video records to exonerate drivers and dispute fraudulent damage claims, and providing software coaching workflows to analyze and improve driver safety.
Vehicle Telematics: Provides a robust, real-time telematics solution with GPS tracking, routing and dispatch, fuel efficiency management, electric vehicle usage and charge planning, preventative maintenance, and diagnostics capabilities to efficiently manage vehicle fleets in a sustainable way.
Apps and Driver Workflows: Improves driver productivity and enables regulatory compliance, as drivers see upcoming jobs, capture electronic documents, perform maintenance inspections, maintain compliance logs, and message with back-office administration.
Building on our experience in connected fleets, our industry-agnostic architecture and culture of innovation enabled us to add new data to our Connected Operations Cloud and develop new Applications across physical operations, including:
Equipment Monitoring: Provides rich visibility and management of distributed equipment, from generators and compressors to heavy construction equipment and trailers, improving operating efficiency and preventing unplanned downtime.
Site Visibility: Provides remote visibility for IP cameras—whether provisioned by Samsara or a third party—with mobile and cloud-based software to improve site security and incident response times, and proprietary AI algorithms to power alerting and search features.”
Market Opportunity
From the S-1: “Our Connected Operations Cloud provides a digital hub for physical operations that we believe is addressing a large and rapidly growing market opportunity. We estimate our total addressable market opportunity to be approximately $54.6 billion by the end of 2021, growing at a three-year overall compound annual growth rate of approximately 21.0% to $96.9 billion by the end of 2024…This opportunity consists of our current applications that include connected fleet, connected equipment and connected sites. Our connected fleet opportunity is represented by the global commercial telematics market, which, based on estimates provided by Gartner, we calculate to be a $32.9 billion market in 2021, growing to $63.7 billion in 2024.”
How Samsara Makes Money
From the S-1: “In each of the past two fiscal years, we generated approximately 98% of our revenue from subscriptions to our Connected Operations Cloud, which today includes Applications for video-based safety, vehicle telematics, apps and driver workflows, equipment monitoring, and site visibility. A subscription to our Connected Operations Cloud includes IoT data collection, which comes from a Samsara IoT device, such as an Internet gateway, camera or sensor, or at times from a third-party solution; cellular connectivity for our IoT devices; access to our cloud Applications, APIs and the Samsara App Marketplace; customer support; and warranty coverage. We price our subscriptions on a per asset, per application basis. For example, one vehicle using two Applications (video-based safety and vehicle telematics) would count as two subscriptions. A five-building site with each building having one piece of equipment and using two Applications (equipment monitoring and site visibility) would count as ten subscriptions.”
Benchmark Data
The data shown below depicts how the Samsara data compares to the operating metrics of current public SaaS businesses.
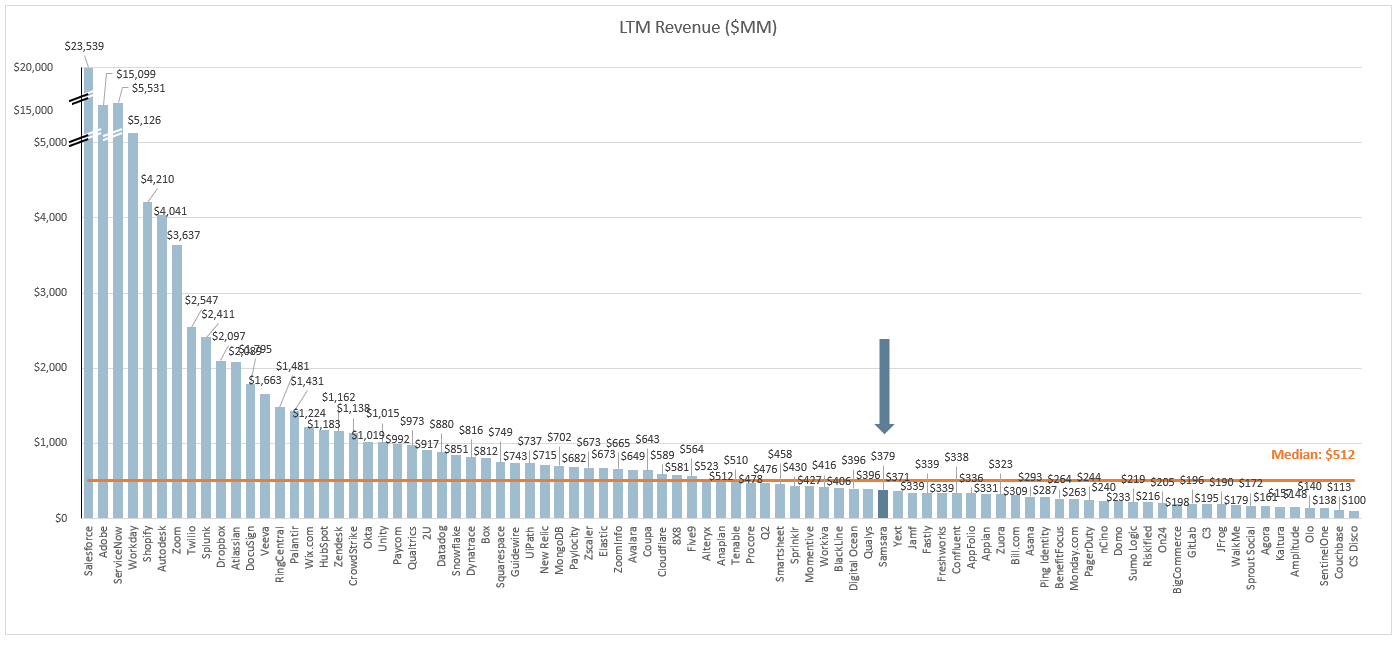
Last Twelve Months (LTM) Revenue
Samsara’s LTM revenue was $379M
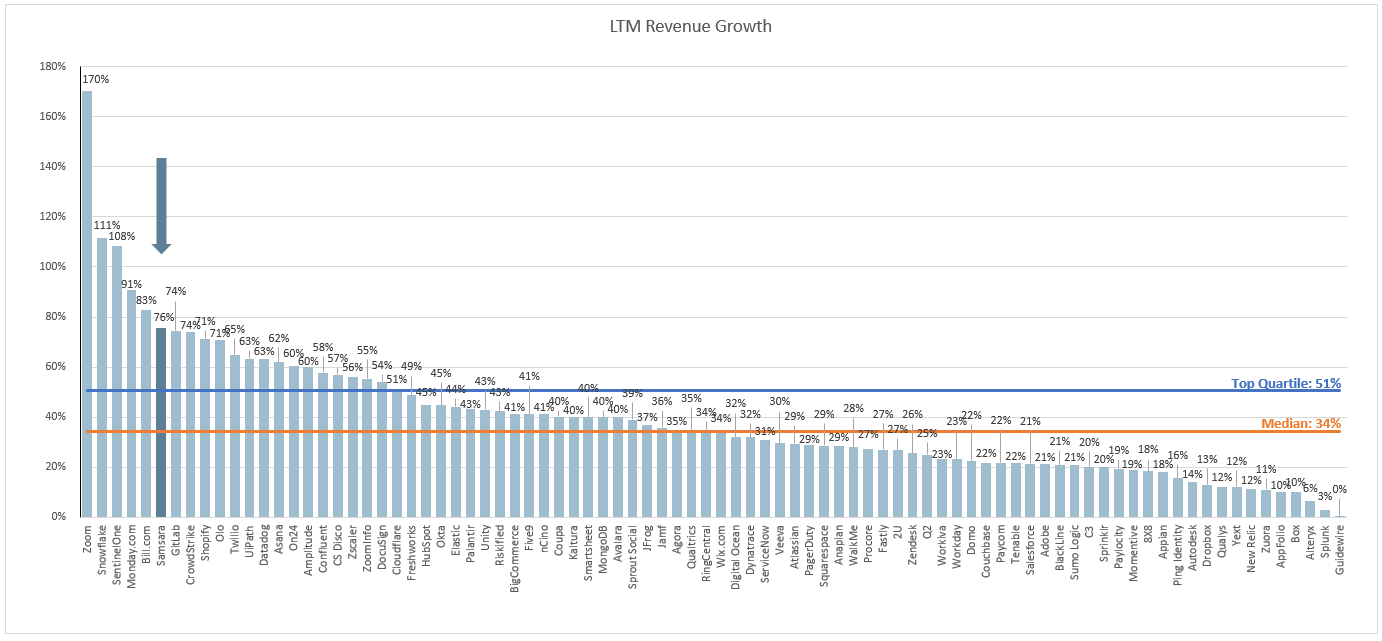
LTM Revenue Growth
Samsara grew revenue 76% over the last 12 months
Quarterly YoY Revenue Growth Trends
Samsara has held YoY revenue growth >70% the last few quarters
LTM GAAP Gross Margin
Samsara’s gross margins are 72%
Samsara gross margins have held steady the last 4 quarters
LTM GAAP Operating Margin
Samsara’s operating margins are (36%)
Samsara’s operating margin has steadily improved over the last 4 quarters
Net Revenue Retention
This metric is calculated by taking the annual recurring revenue of a cohort of customers from 1 year ago, and comparing it to the current annual recurring revenue of that same set of customers (even if you experienced churn and that group of customers now only has 9, or anything <10).
Samsara’s net revenue retention is >115% (they don’t give the esact figure in the S1)
Gross Margin Adjusted CAC Payback
(Previous Q S&M) / (Net New ARR x Gross Margin) x 12. This metric demonstrates how long it takes (in months) for a customer to pay back the cost at which it took to acquire them.
Samsara’s CAC payback is 18 months
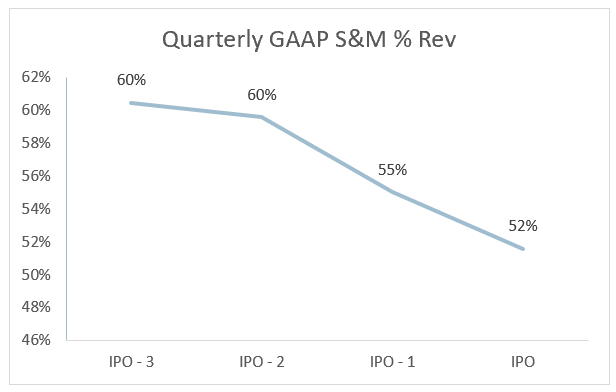
LTM S&M Expense as % of LTM Revenue
Samsara spent 56% of revenue on S&M over the last year
Samsara has been spending less on S&M as a percentage of revenue over the last 4 quarters
Rule of 40
In the below chart I’m showing LTM revenue growth + LTM FCF margin.
Samsara’s rule of 40 is 31%
This post and the information presented are intended for informational purposes only. The views expressed herein are the author’s alone and do not constitute an offer to sell, or a recommendation to purchase, or a solicitation of an offer to buy, any security, nor a recommendation for any investment product or service. While certain information contained herein has been obtained from sources believed to be reliable, neither the author nor any of his employers or their affiliates have independently verified this information, and its accuracy and completeness cannot be guaranteed. Accordingly, no representation or warranty, express or implied, is made as to, and no reliance should be placed on, the fairness, accuracy, timeliness or completeness of this information. The author and all employers and their affiliated persons assume no liability for this information and no obligation to update the information or analysis contained herein in the future.


