Toast: Benchmarking the S-1 Data
Recently Toast their initial S1 statement. A S-1 is a document companies file with the SEC in preparation for listing their shares on an exchange like the NYSE or NASDAQ. The document contains a plethora of information on the company including a general overview, up to date financials, risk factors to the business, cap table highlights and much more. The purpose of the detailed information is to help investors (both institutional and retail) make informed investment decisions. There’s a lot of info to digest, so in the sections below I’ll try and pull out the relevant financial information and benchmark it against current cloud businesses. As far as an expected timeline - typically companies launch their roadshow ~3 weeks after filing their initial S-1 (the roadshow launches with an updated S-1 that contains a price range). After the roadshow launch there’s typically ~2 weeks before the stock starts trading. So we’re looking at roughly 5 weeks before any retail investor can buy the stock.
Toast Overview
From the S1 - “Toast is a cloud-based, end-to-end technology platform purpose-built for the entire restaurant community. Our platform provides a comprehensive suite of software as a service, or SaaS, products, financial technology solutions including integrated payment processing, restaurant-grade hardware, and a broad ecosystem of third-party partners. We serve as the restaurant operating system, connecting front of house and back of house operations across dine-in, takeout, and delivery channels. As of June 30, 2021, approximately 48,000 restaurant locations across approximately 29,000 customers, processing over $38 billion of gross payment volume in the trailing 12 months, partnered with Toast to optimize operations, increase sales, engage guests, and maintain happy employees.”
Product Overview
From the S-1: “Our platform is purpose-built to drive success for the entire restaurant community. We provide our customers with a single platform that gives them the tools and features they need to run their business across point of sale, or POS, restaurant operations, digital ordering and delivery, marketing and loyalty, and team management. This suite of software and hardware products is integrated with our financial technology solutions, which includes payment processing and other products such as those provided by Toast Capital. In addition, we provide platform services that include reporting and analytics and e-commerce capabilities for restaurants to access additional products in a self-service manner, as well as the Toast application programming interface, or API, and partner ecosystem, allowing our customers to seamlessly connect with other technology vendors.”
Market Opportunity
From the S-1: “The restaurant industry has lacked a clear technology category leader and has been categorized by fragmentation and historically slow adoption of technology. We are now seeing a shift in the use of technology alongside a preference for a single, integrated, digital-first technology platform, resulting in a significant opportunity for Toast. Restaurants in the United States spent an estimated $25 billion on technology in 2019, or less than 3% of their total sales.14 We expect the spend on technology to increase to $55 billion by 2024, as technology spend as a percent of restaurant sales closes the gap with other industry verticals. We believe our total addressable market, or TAM, is closely aligned with, and encompasses the vast majority of, this restaurant spend.
We estimate our current serviceable addressable market to be approximately $15 billion. We calculate this figure by adding the opportunities across our software and financial technology products. Our software addressable market is calculated by multiplying the average annual subscription revenue per location per product by the estimated number of restaurant locations in the United States. We determined the estimated number of restaurant locations in the United States to be approximately 860,000,15 which includes restaurants across all segments, given we serve restaurants of all types and sizes ranging from single-location restaurants to larger multi-location brands. The opportunity for payments recurring run-rate is calculated by multiplying the estimated non-cash restaurant sales in the United States for 2021 by our average take rate of approximately 55 basis points (measured as a percentage of GPV). Lastly, we estimate the Toast Capital opportunity by multiplying an estimated $29.5 billion of outstanding U.S. public banks’ restaurant loans as of March 31, 202016 by the average annual interest rate on small business loans of 1.4% to 7.2%. “
How Toast Makes Money
Toast generates revenue through 4 main revenue streams: subscription services, financial technology solutions, hardware, and professional services.
Subscription services revenue is generated from fees charged to customers for access to our SaaS products, such as POS, kitchen display system, invoice management, digital ordering and delivery, marketing and loyalty, and team management. Subscription services pricing is primarily based on a rate per location, which varies depending on the number of SaaS products purchased, hardware configuration, and employee count.
Financial technology solutions revenue consists primarily of fees paid by our customers to facilitate their payment transactions. The transaction fee is generally calculated as a percentage of the total transaction amount processed, plus a fixed per-transaction fee. The transaction fees collected are recognized as revenue on a gross basis inclusive of all fees and costs paid to issuers and card networks as well as other related fees associated with third-party payment processors and fraud management. Financial technology solutions revenue also includes fees earned from marketing and servicing working capital loans to our customers through Toast Capital that are originated by a third-party bank and that range from $5,000 to $100,000.
Hardware revenue is primarily derived from the sale of terminals, tablets, handhelds, and related devices and accessories. We also generate professional services revenue from installation and configuration services for new locations joining the Toast platform and new products added by existing locations.
Benchmark Data
The data shown below depicts how the Toast data compares to the operating metrics of current public SaaS businesses.
Last Twelve Months (LTM) Revenue
LTM Revenue Growth
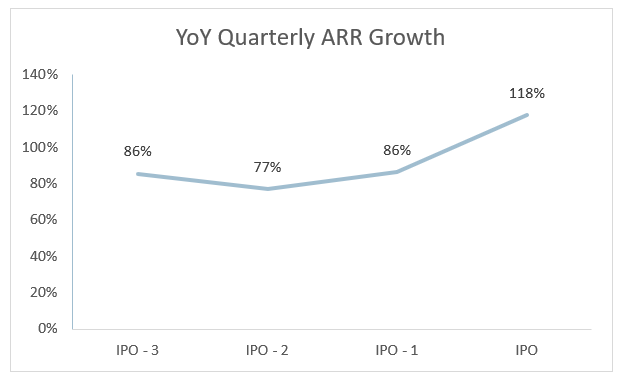
Quarterly YoY Annualized Recurring Revenue Growth Trends
Annualized recurring revenue is a better metric to look at when evaluating the “health” of the business. Toast has a mixture of subscription and “consumption,” where consumption takes the form of fintech revenue. They define ARR as: “taking the sum of (i) twelve times the subscription component of MRR and (ii) four times the trailing-three-month cumulative payments component of MRR. We believe this approach provides an indication of our scale, while also controlling for short-term fluctuations in payments volume.”
As you can see the business is accelerating quite nicely
LTM GAAP Gross Margin
Given the heavy payment / fintech revenue, Toast’s gross margins are lower than classic software gross margins. As I listed in the “How Toast Makes Money” section above, you’ll see that they recognize a gross payments revenue figure as revenue. This means that they are netting out payments made to issuers and card networks as well as other related fees associated with third-party payment processors in COGS.
Because of this, my take is that when evaluating Toast a EV / GP multiple should be used, and not a EV / Revenue mujltiple
Toast’s GAAP gross margins have stayed relatively constant over the last 4 quarters
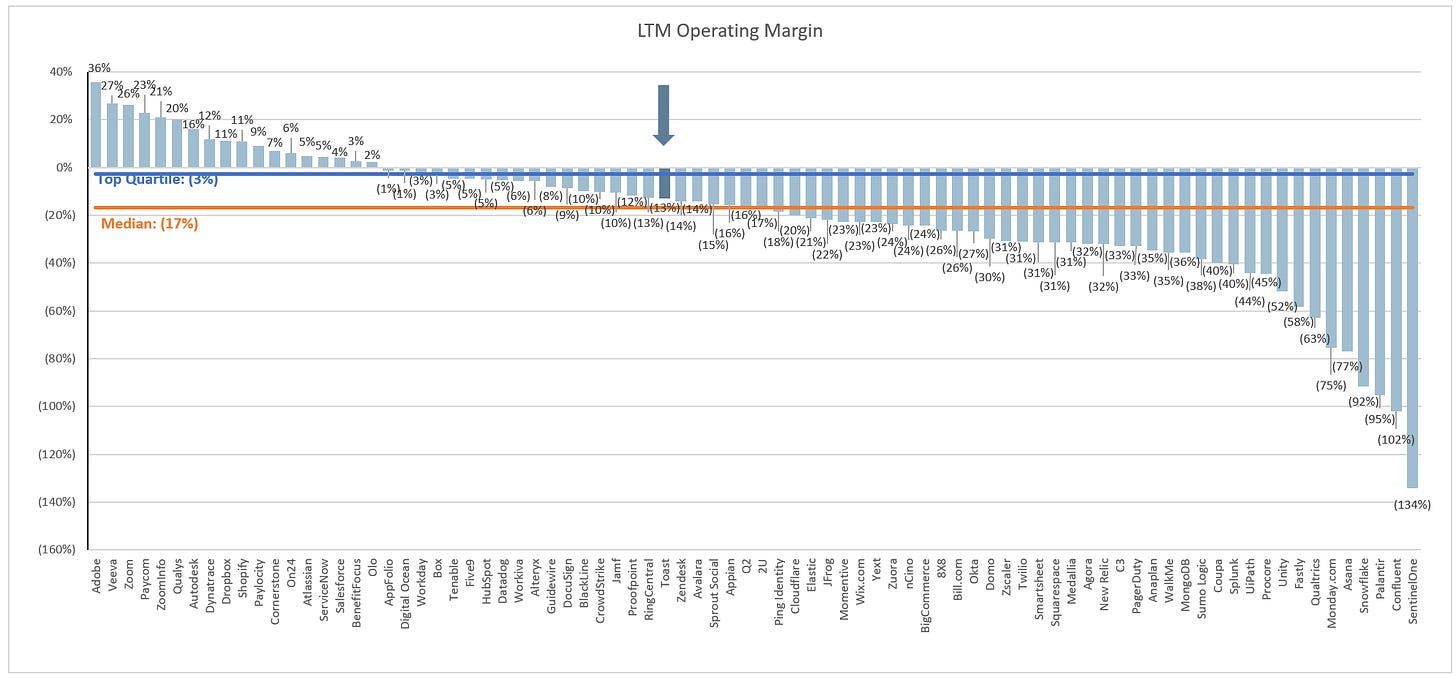
LTM GAAP Operating Margin
Toast’s quarterly GAAP Operating Margin has improved slightly over the last 4 quarters
Net Retention Rate
This metric is calculated by taking the annual recurring revenue of a cohort of customers from 1 year ago, and comparing it to the current annual recurring revenue of that same set of customers (even if you experienced churn and that group of customers now only has 9, or anything <10).
Toast defines NRR as: “To calculate our Net Retention Rate, or NRR, we first identify a cohort of customers, or the Base Customers, in a particular month, or the Base Month. For this purpose, we do not consider a customer as a Base Customer unless there is at least one location live on the Toast platform for the entirety of the Base Month. We then divide MRR for the Base Customers in the same month of the subsequent year, or the Comparison Month, by MRR in the Base Month to derive a monthly NRR. MRR in the Comparison Month includes the impact of any churn or contraction of the Base Customers, and by definition does not include any customers added to the Toast platform between the Base Month and Comparison Month. We measure the annual NRR by taking a weighted average of the monthly NRR over the trailing twelve months.
Gross Margin Adjusted CAC Payback
(Previous Q S&M) / (Net New ARR x Gross Margin) x 12. This metric demonstrates how long it takes (in months) for a customer to pay back the cost at which it took to acquire them. In the chart below I’m taking the average of the 4 quarters leading up to IPO to normalize the business.
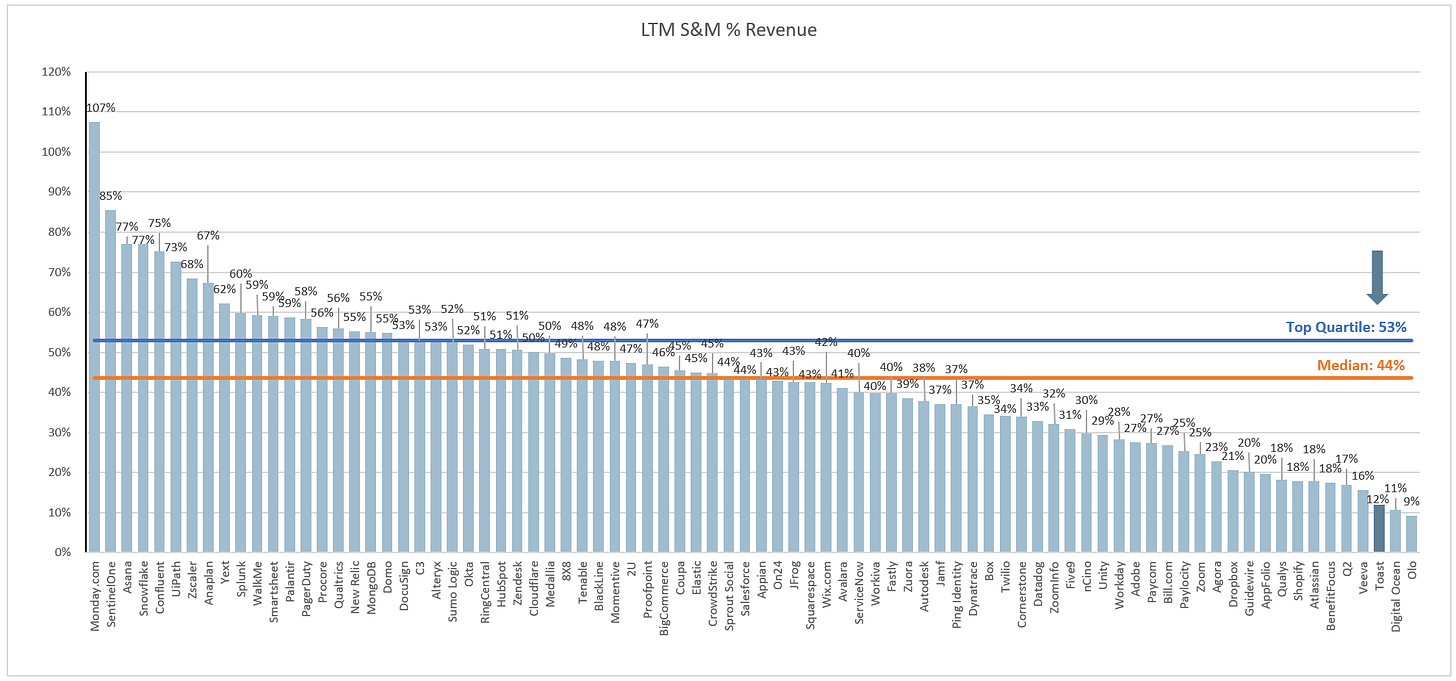
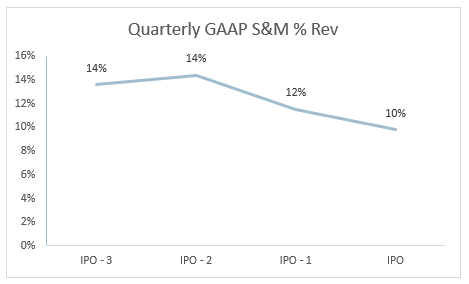
LTM S&M Expense as % of LTM Revenue
Toast spends very little on S&M, and the GAAP S&M as a % of revenue has gone down over the last 4 quarters
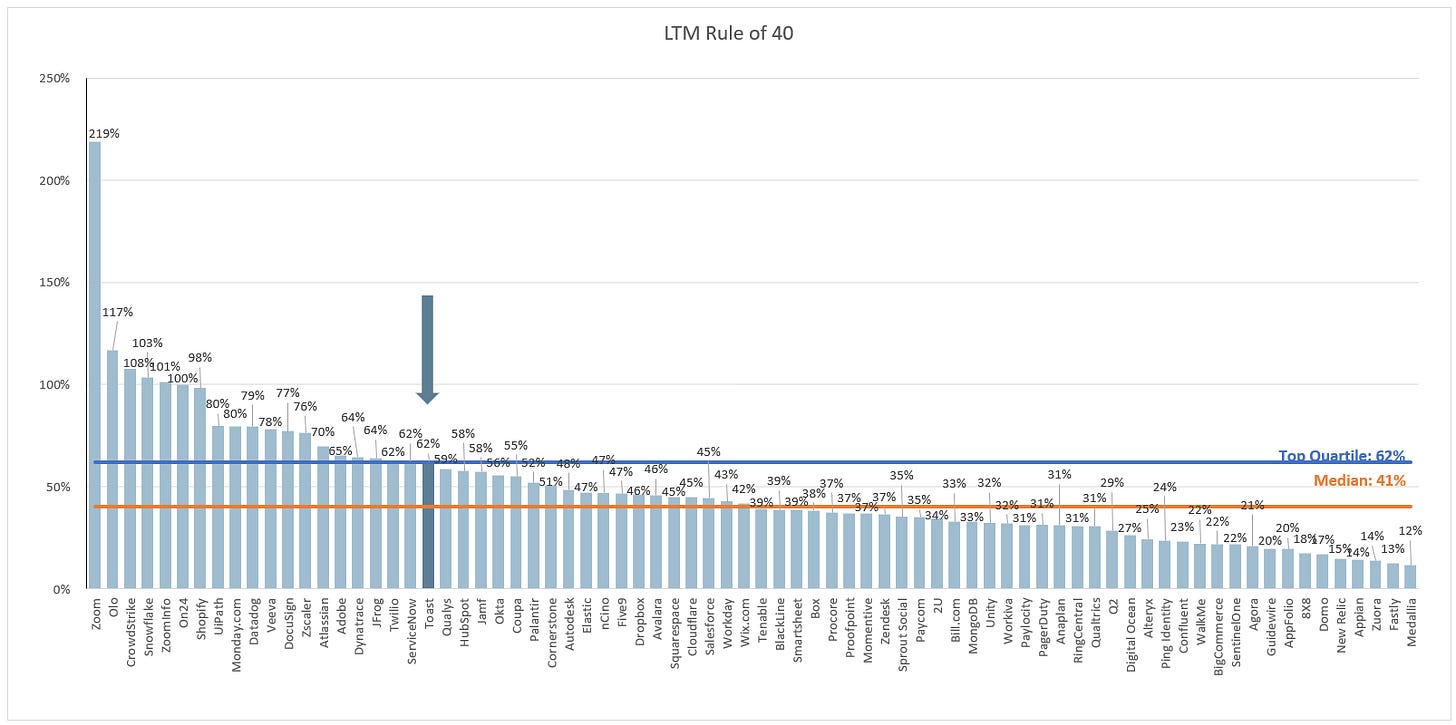
Rule of 40
In the below chart I’m showing LTM revenue growth + LTM FCF margin.
This post and the information presented are intended for informational purposes only. The views expressed herein are the author’s alone and do not constitute an offer to sell, or a recommendation to purchase, or a solicitation of an offer to buy, any security, nor a recommendation for any investment product or service. While certain information contained herein has been obtained from sources believed to be reliable, neither the author nor any of his employers or their affiliates have independently verified this information, and its accuracy and completeness cannot be guaranteed. Accordingly, no representation or warranty, express or implied, is made as to, and no reliance should be placed on, the fairness, accuracy, timeliness or completeness of this information. The author and all employers and their affiliated persons assume no liability for this information and no obligation to update the information or analysis contained herein in the future.








Why didn't base the S&M as a percentage of GP instead of revenue?
Why didn't base the S&M as a percentage of GP instead of revenue?