Today BigCommerce filed their initial S1 statement. They will almost undoubtedly be compared to Shopify! In my mind Shopify is clearly superior. A S1 is a document companies file with the SEC in preparation for listing their shares on an exchange like the NYSE or NASDAQ. The document contains a plethora of information on the company including a general overview, up to date financials, risk factors to the business, cap table highlights and much more. The purpose of the detailed information is to help investors (both institutional and retail) make investment decisions. Generally companies launch their roadshows ~3 weeks after filing their first public S1 and start trading 2 weeks after that. I’d anticipate BigCommerce plans to start trading in ~4-5 weeks. There’s a lot of info to digest, so in the sections below I’ll try and pull out the relevant financial information and benchmark it against recent cloud IPOs.
BigCommerce Overview
From the S1 - “BigCommerce is leading a new era of eCommerce. Our software-as-a-service (“SaaS”) platform simplifies the creation of beautiful, engaging online stores by delivering a unique combination of ease-of-use, enterprise functionality, and flexibility. We power both our customers’ branded eCommerce stores and their cross-channel connections to popular online marketplaces, social networks, and offline point-of-sale (“POS”) systems. BigCommerce operates at the forefront of a world of commerce that is changing rapidly. The transition from physical to digital commerce constitutes one of history’s biggest changes in human behavior, and the pace of change is accelerating.”
“IDC estimates that the global market for digital commerce applications, which we refer to as “eCommerce platforms,” was $4.7 billion in 2019 and is expected to grow at a compound annual growth rate (“CAGR”) of 11% to reach $7.8 billion in 2024. This global market includes legacy eCommerce platforms and SaaS eCommerce platforms. We believe our total addressable market is materially larger than eCommerce platform spend due to the additional revenue share that we earn from our technology partner ecosystem. “
About 75% of their revenue comes from subscriptions.
Benchmark Data
The data shown below depicts how BigCommerce compares to the operating metrics of current public SaaS businesses. In previous posts I showed the data as it compared to other SaaS IPOs at the time of their IPO. I didn’t think this was a very useful analysis, so I changed it to compare BigCommerce data to current data for other SaaS companies. I’ve highlighted BigCommerce in orange so you can pick them out.
Last Twelve Months (LTM) Revenue
As you can see, BigCommerce is on the smaller end of public SaaS companies. Generally $100M of LTM revenue is the threshold to becoming public. One thing I want to point out. In the S1 BigCommerce quotes an ARR number of $137M. I think this is misleading (their ARR is not annual recurring revenue, but annual revenue run-rate). In their version of ARR they include non-recurring service revenue such as one-time partner integration fees and store-launch services. Their implied true ARR (subscription revenue x 4) is closer to $100M. Roughly 75% of their revenue is subscription.

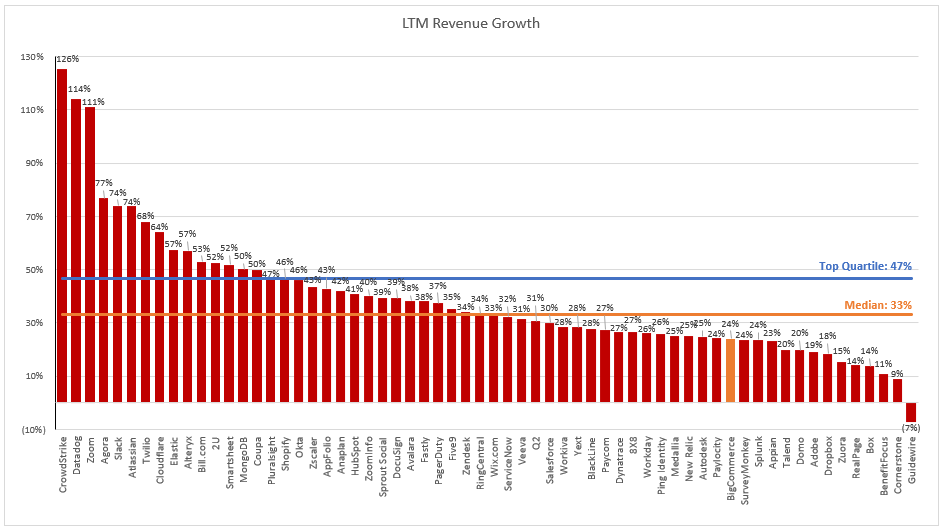
LTM Revenue Growth
LTM revenue growth is well below the median. 24% (of trailing revenue growth) for a public company is nothing to be excited about. That being said, they are seeing some tailwinds from Covid and experienced some accelerated revenue growth. Q1 YoY rev growth was 30%.

LTM GAAP Gross Margin
Middle of the pack gross margins

LTM GAAP Operating Margin
Negative 32% GAAP operating margin is in the bottom third. It’s a little concerning to see this combined with lower growth.

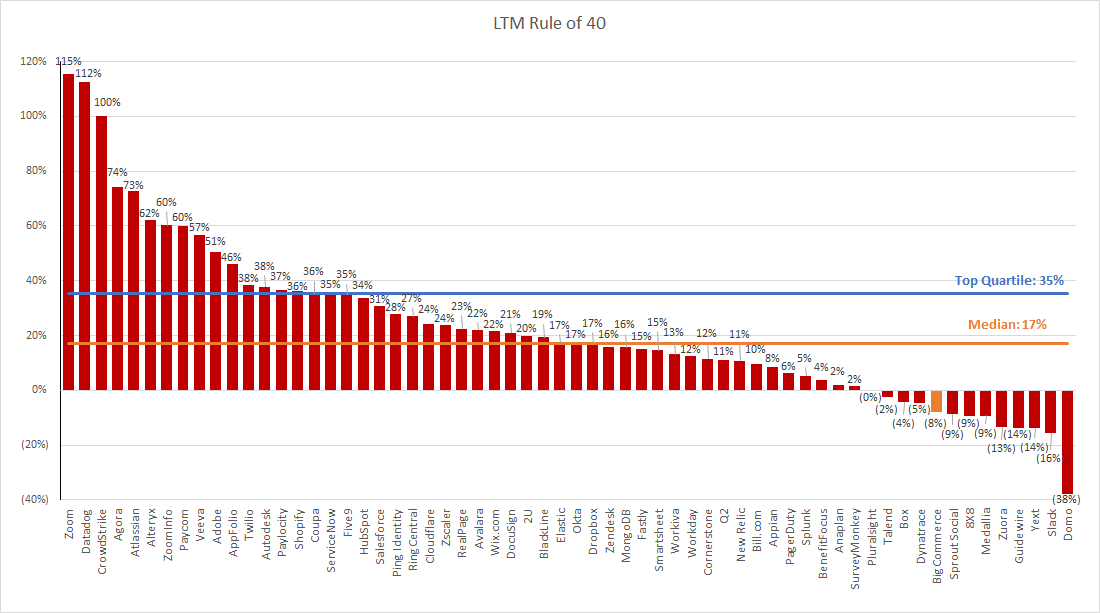
LTM Rule of 40 (Revenue Growth + Operating Margin)
You can see the combination of growth + profitability is not very attractive for BigCommerce

Net Revenue Retention
This metric is calculated by taking the annual recurring revenue of a cohort of customers from 1 year ago, and comparing it to the current annual recurring revenue of that same set of customers (even if you experienced churn and that group of customers now only has 9, or anything <10). BigCommerce has a slightly different calculation for the metric which in my mind OVERSTATES their net retention. This number represents the net retention for customers with >$2k ACV. This group represents roughly 80% of total revenue. It’s fair to assume the net retention for the group of customers <$2k ACV would be less than the 108%, bringing the overall net retention down.

Gross Margin Adjusted CAC Payback
(Previous Q S&M) / (Net New ARR x Gross Margin) x 12. This metric demonstrates how long it takes (in months) for a customer to pay back the cost at which it took to acquire them. In the chart below I’m taking the average of the 4 quarters leading up to IPO to remove any seasonality out outliers. In this metric I’m using my calculated implied ARR that excludes the non-recurring service revenue.

Valuation
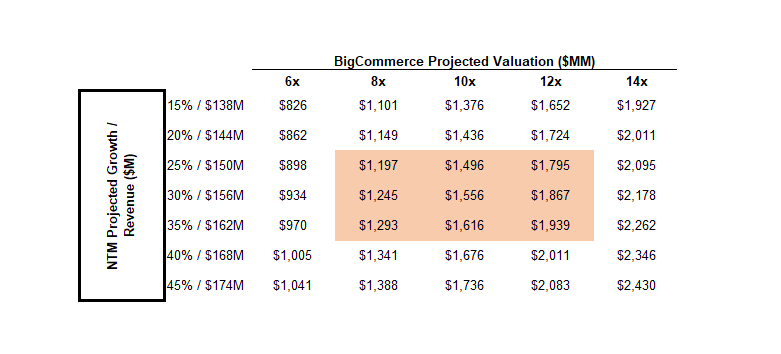
Predicting the valuation of pending IPOs is nearly impossible, but it adds to the fun to make predictions! In the SaaS / Cloud world companies are valued off a multiple of their revenue. Generally this is a projected revenue number, and for the purpose of this analysis I will be looking at NTM (next twelve months) projections. When I think about what a company will be worth I first like to look at how other public companies are valued. When I review the financial profile against other SaaS businesses, I think BigCommerce should trade at a discount to other medium growth SaaS businesses given the lower margins and unit economics. The median multiple for this bucket is ~14x forward revenue, so at this time I’m assuming BigCommerce will get a ~10x forward revenue number. I don’t think they’ll trade higher than Wix.com (14x). Given the slight acceleration to the business because of Covid (we won’t really know this effect until we see Q2 data which should be included in a future version of the S1), I think the NTM growth rate will fall around 30% (but this is the big variable!). As a reminder LTM growth was 24%. Given that, my prediction is the company will be worth ~$1.5-$2B when it goes public!


Why do you take GAAP operating margins, wont Non GAAP margins be a more useful indicator removing abnormalities like SBC etc?
Excellent analysis. I am pointing our readers to this post via https://pipecandy.com/newsletter.