Clouded Judgement 11.20.20
Every week I’ll provide updates on the latest trends in SaaS valuations, earnings announcements, and highlight any significant news. Follow along to stay up to date!
Highlight of the Week - Growth Past $75M ARR
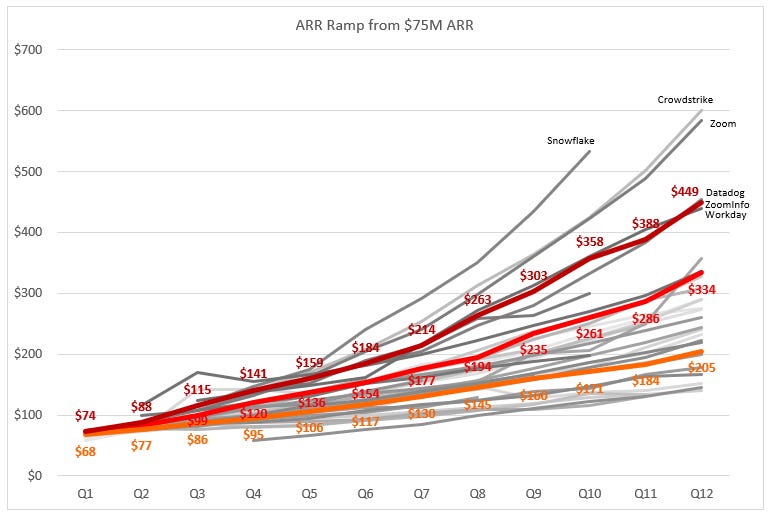
A lot of focus and attention is given to the speed at which companies hit $100M ARR. While this is important, it’s just one leg of a company’s journey. To become a best in class SaaS businesses companies must continue growth trajectories well past $100M ARR. Below is a chart that summarizes the ARR trajectories of ~40 SaaS businesses for the 3 years after they crossed $75M ARR. As you can see from the data below, the best companies grow ARR at ~100% for 2 straight years after crossing $75M ARR
Earnings Summary
Not many cloud businesses reported this week, here’s the summary:
Top 10 EV / NTM Revenue Multiples
Top 10 Weekly Share Price Movement
Update on Multiples
SaaS businesses are valued on a multiple of their revenue - in most cases the projected revenue for the next 12 months. Multiples shown below are calculated by taking the Enterprise Value (market cap + debt - cash) / NTM revenue. In the buckets below I consider high growth >30% projected NTM growth, mid growth 15%-30% and low growth <15%
Overall Stats:
Overall Median: 15.5x
Top 5 Median: 40.5x
3 Month Trailing Average: 15.0x
1 Year Trailing Average: 11.9x
Bucketed by Growth:
High Growth Median: 30.6x
Mid Growth Median: 16.0x
Low Growth Median: 7.3x
Operating Metrics
Median NTM growth rate: 20%
Median LTM growth rate: 31%
Median Gross Margin: 74%
Median Operating Margin (15%)
Median FCF Margin: 5%
Median Net Retention: 116%
Median CAC Payback: 25 months
Median S&M % Revenue: 43%
Median R&D % Revenue: 25%
Median G&A % Revenue: 17%
News
Snowflake announced a set of new features to their Data Marketplace product, as well as Snowpack - A new developer experience that will allow data engineers, data scientists, and developers to write code in their languages of choice, using familiar programming concepts, and then execute workloads such as ETL/ELT, data preparation, and feature engineering on Snowflake
Bill.com Launches Tailored Offering for Wealth Management Firms to Help Deliver Bill Pay Services for High-Net-Worth Clients
Autodesk acquired Spacemaker AI for $240M
Comps Output
Rule of 40 shows LTM growth rate + LTM FCF Margin. FCF calculated as Cash Flow from Operations - Capital Expenditures
GM Adjusted Payback is calculated as: (Previous Q S&M) / (Net New ARR in Q x Gross Margin) x 12 . It shows the number of months it takes for a SaaS business to payback their fully burdened CAC on a gross profit basis. Most public companies don’t report net new ARR, so I’m taking an implied ARR metric (quarterly subscription revenue x 4). Net new ARR is simply the ARR of the current quarter, minus the ARR of the previous quarter. Companies that do not disclose subscription rev have been left out of the analysis and are listed as NA.


