Clouded Judgement 12.23.22 - Q3 Earnings Review
Every week I’ll provide updates on the latest trends in cloud software companies. Follow along to stay up to date!
Weakness in Software
We’re now through Q3 earning season. After going through the data I wanted to highlight 4 data points that show some initial weakness in software fundamentals creeping in. As I’ve said many times before, in 2023 the focus for software valuations will completely shift from interest rates (and multiples) to fundamentals. Here are the four data points:
Net New ARR: Net new ARR added in a quarter represents new customer ARR + expansion ARR - churn / contraction ARR. You want to see this number going up sequentially every quarter. For software businesses, generally the sales capacity goes up every quarter (as you ramp more reps), so you want the net new ARR added every quarter to go up. If it doesn’t, it implies a hit to productivity (or a decrease in capacity which doesn’t’ happen often). When we look at the data for Q3, it’s clear that net new ARR added each quarter is slowing across the board. The below chart shows Q3 Net New ARR minus the prior 4 quarters average net new ARR. Negative figures mean that the net new ARR added in Q3 was less than the prior 4 quarters average. What is so striking about the below chart is that the majority of companies added less net new ARR in Q3 than the 4 quarters prior average. This is especially striking given we’re comparing Q3 to a 4 quarter average (when the status quo should be net new going up every quarter).
The below chart shows the same data but as a %. The formula is (Q3 NNARR / Trailing 4Q NNARR Average) - 1. So a negative percentage shows companies who added less NNARR in Q3 vs the trailing 4Q average
Payback periods going up: across the board, software companies were less efficient acquiring incremental ARR in Q3 than they have been historically. This should be no surprise given the trends in net new ARR. But I wanted to show the data. The below chart shows the median gross margin adjusted payback period for the software universe for the last 9 quarters. The median is typically in the low to mid 20’s (months), but this last quarter it creeped up to 38 months. No surprise to see this data given the hiring trends of the last 18 months. I think we’ll see hiring slow down across the board next year and efficiency will pick back up.
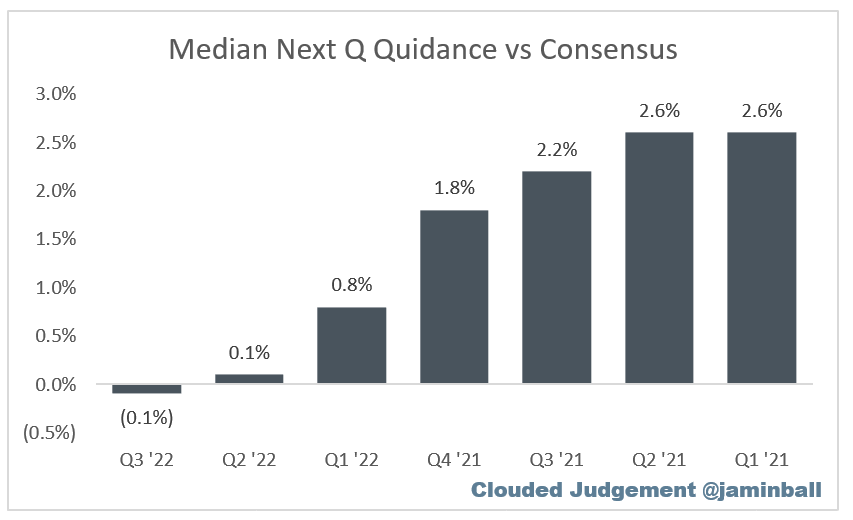
Weak Q4 guides in Q3. Public companies are clearly gearing up for a lighter Q4. Generally when software companies provide guidance for an upcoming quarter, ~75%+ of companies guide above next quarters consensus estimates, with the median “guidance raise” being ~2.5-3% above consensus. In Q3, only 47% of companies guided Q4 above consensus, and the median Q4 guide was actually (0.1%) below Q4 consensus. The below chart shows what the median guidance was relative to consensus estimates for the last few quarters. As you can see, guidance has gotten quite a bit weaker over the last couple quarters.
2023 consensus estimates starting to come down. Wrapping this all up, we’re now starting to see 2023 estimates revised down. The below chart shows the change in 2023 consensus revenue estimates pre / post earnings. As you can see, the majority of companies had their 2023 estimates revised downward. My guess is we’ll see this trend continue after Q4 earnings
I see similar trends in a lot of the private software companies I work with. Q3 was a tough quarter. If you saw some weakness creep in, you’re definitely not alone.
I also thought I’d look at how 2023 consensus revenue estimates today compared to where they were in at the beginning of the year (Jan ‘22). The chart below shows today’s ‘23 estiamates vs ‘23 estimates from January. A positive percentage implies ‘23 estimates are higher than where they were at the start of the year.
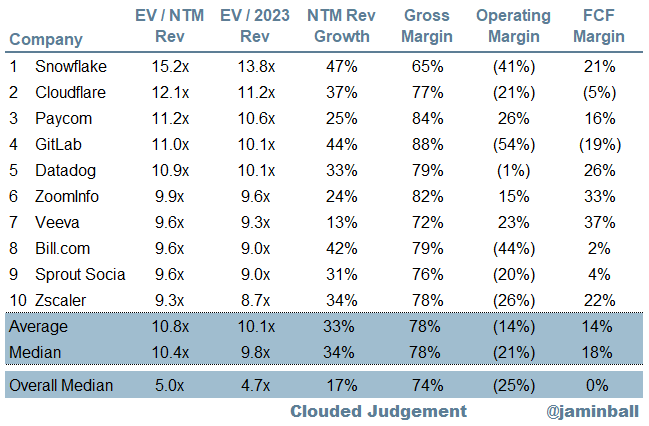
Top 10 EV / NTM Revenue Multiples
Top 10 Weekly Share Price Movement
Update on Multiples
SaaS businesses are generally valued on a multiple of their revenue - in most cases the projected revenue for the next 12 months. Revenue multiples are a shorthand valuation framework. Given most software companies are not profitable, or not generating meaningful FCF, it’s the only metric to compare the entire industry against. Even a DCF is riddled with long term assumptions. The promise of SaaS is that growth in the early years leads to profits in the mature years. Multiples shown below are calculated by taking the Enterprise Value (market cap + debt - cash) / NTM revenue.
Overall Stats:
Overall Median: 5.0x
Top 5 Median: 11.2x
10Y: 3.7%
Bucketed by Growth. In the buckets below I consider high growth >30% projected NTM growth, mid growth 15%-30% and low growth <15%
High Growth Median: 9.4x
Mid Growth Median: 5.2x
Low Growth Median: 2.6x
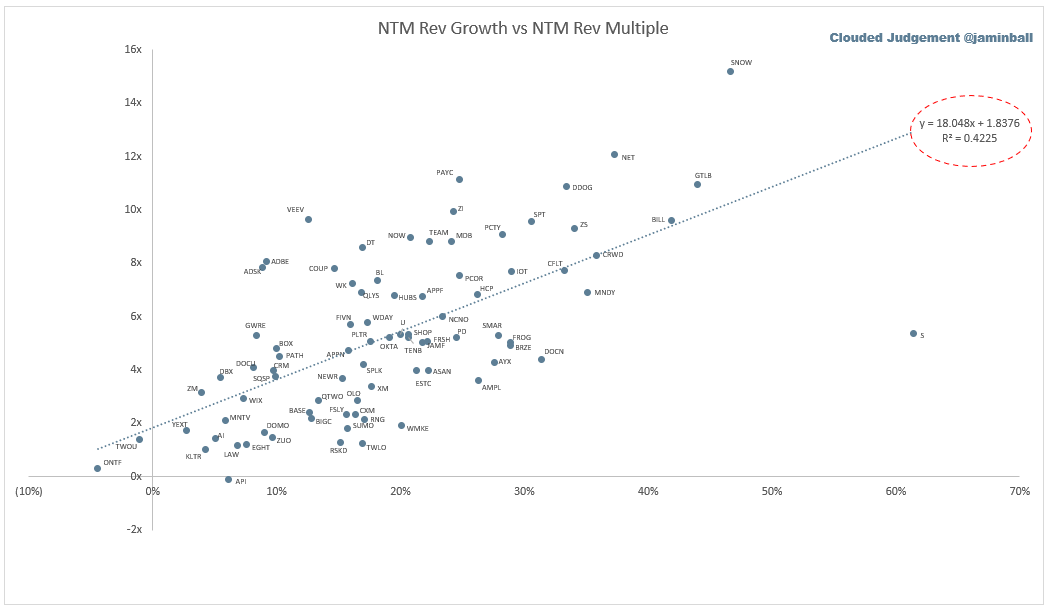
Scatter Plot of EV / NTM Rev Multiple vs NTM Rev Growth
How correlated is growth to valuation multiple?
Growth Adjusted EV / NTM Rev
The below chart shows the EV / NTM revenue multiple divided by NTM consensus growth expectations. The goal of this graph is to show how relatively cheap / expensive each stock is relative to their growth expectations
Operating Metrics
Median NTM growth rate: 17%
Median LTM growth rate: 29%
Median Gross Margin: 74%
Median Operating Margin (25%)
Median FCF Margin: 0%
Median Net Retention: 119%
Median CAC Payback: 38 months
Median S&M % Revenue: 48%
Median R&D % Revenue: 28%
Median G&A % Revenue: 20%
Comps Output
Rule of 40 shows LTM growth rate + LTM FCF Margin. FCF calculated as Cash Flow from Operations - Capital Expenditures
GM Adjusted Payback is calculated as: (Previous Q S&M) / (Net New ARR in Q x Gross Margin) x 12 . It shows the number of months it takes for a SaaS business to payback their fully burdened CAC on a gross profit basis. Most public companies don’t report net new ARR, so I’m taking an implied ARR metric (quarterly subscription revenue x 4). Net new ARR is simply the ARR of the current quarter, minus the ARR of the previous quarter. Companies that do not disclose subscription rev have been left out of the analysis and are listed as NA.
This post and the information presented are intended for informational purposes only. The views expressed herein are the author’s alone and do not constitute an offer to sell, or a recommendation to purchase, or a solicitation of an offer to buy, any security, nor a recommendation for any investment product or service. While certain information contained herein has been obtained from sources believed to be reliable, neither the author nor any of his employers or their affiliates have independently verified this information, and its accuracy and completeness cannot be guaranteed. Accordingly, no representation or warranty, express or implied, is made as to, and no reliance should be placed on, the fairness, accuracy, timeliness or completeness of this information. The author and all employers and their affiliated persons assume no liability for this information and no obligation to update the information or analysis contained herein in the future.


For Q4 2022 and for all of 2023, we, growth investors, need to move away from focusing on quarter to quarter performance.
We need to look at forward estimates all the way to Q4 2023...I am advocating a +/- 5 quarter trend approach for most fundamental metrics that I track.
If we continue to make investing decisions quarter to quarter, then we might as well sell good companies like DDOG and buy recession-resilient companies like MCD or just go to cash. BTW - Nothing wrong with MCD or cash - they are certainly portfolio-worthy holdings. But then we cannot call ourselves growth investors when we are doing this.
Cheers and thanks for a great year of informative posts. Your data and charts are the best!
Great read as always. One ping is that the reverse time series on the CaC payback / guidance charts was counter intuitive.