
Clouded Judgement 1.30.25 - The Year of AI Applications

Every week I’ll provide updates on the latest trends in cloud software companies. Follow along to stay up to date!
The Winner of Cheap AI - The Application Layer
There’s been a lot of talk recently about how 2025 is “the year AI applications take off.” I agree with this sentiment - and wanted to talk about one reason why.
If we rewind the clock ~12 months, there were a lot of questions about how business models would have to evolve in the age of AI. Were seat based models dead? Would everyone move to consumption? Would the margins work / would AI take a high margin SaaS business model and make it worse? All of these questions were related, and I think today there’s more clarity on each.
One reason these questions came up was because the cost of inference was high. Said another way, the variable COGS to infuse AI into your application were high. For an AI application that made repeated calls to a LLM model (via an API, based on usage of that product), the costs would ring up quickly. And the challenge was vendors were charging a fixed seat based price. So as each “seat” consumed more and more of the AI features / functionalities the business would generate more costs, but wouldn’t generate more revenue (in a seat based model) - pulling margins down. Was it possible that AI would actually make the software business model worse?? Of course this is an oversimplification, but this was a fear. This lead to questions like would seat based models be able to create a new SKU product with a higher price per seat? Would users be willing to pay a higher price? Would hybrid models emerge that charged a combination of seat + usage based?
What’s happened over the last 12 months is the cost per API call (ie the cost for inference) for these models has plummeted. Open source models like Llama, R1 from DeepSeek, etc have all contributed to this. It’s become even more clear the model calls themselves are commoditizing quickly. And this is great! If the variable “COGS” component of marginal API call approaches zero, many of the questions listed above start to go away. You don’t worry about your margins shrinking, changing the pricing doesn’t become a must, etc. This in turn leads to a LOT more experimenting with AI features / functionalities. The radius of complexity shrinks.
This is all great for AI application builders, and one reason I expect we will start to see an explosion of AI apps this year. As the costs go down, the experimenting will go up, and what we discovery will really start to impress. I’m quite excited for this future!
Quarterly Reports Summary

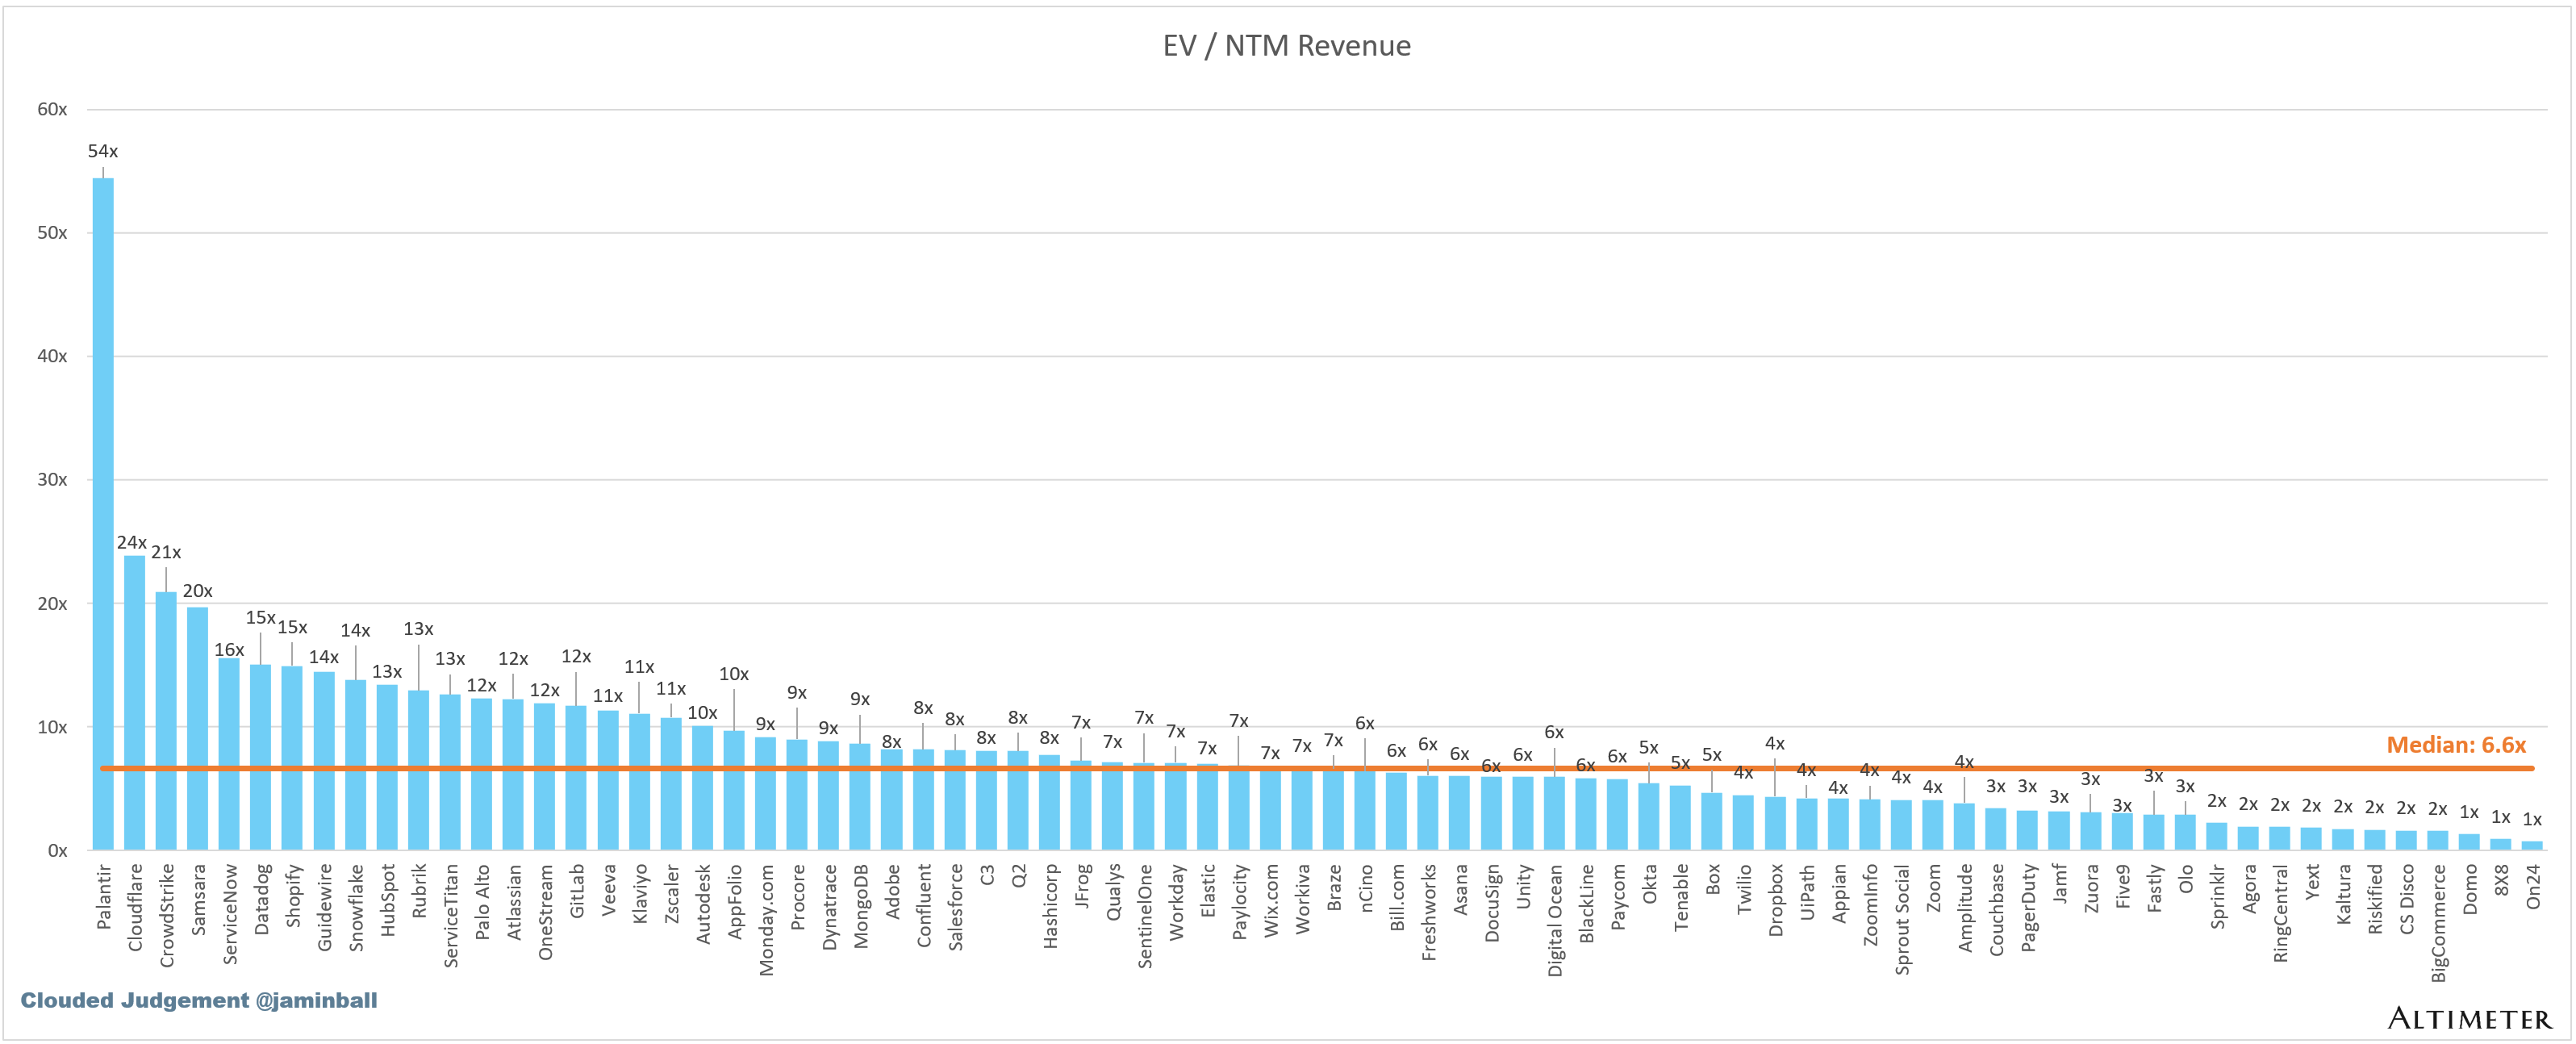
Top 10 EV / NTM Revenue Multiples

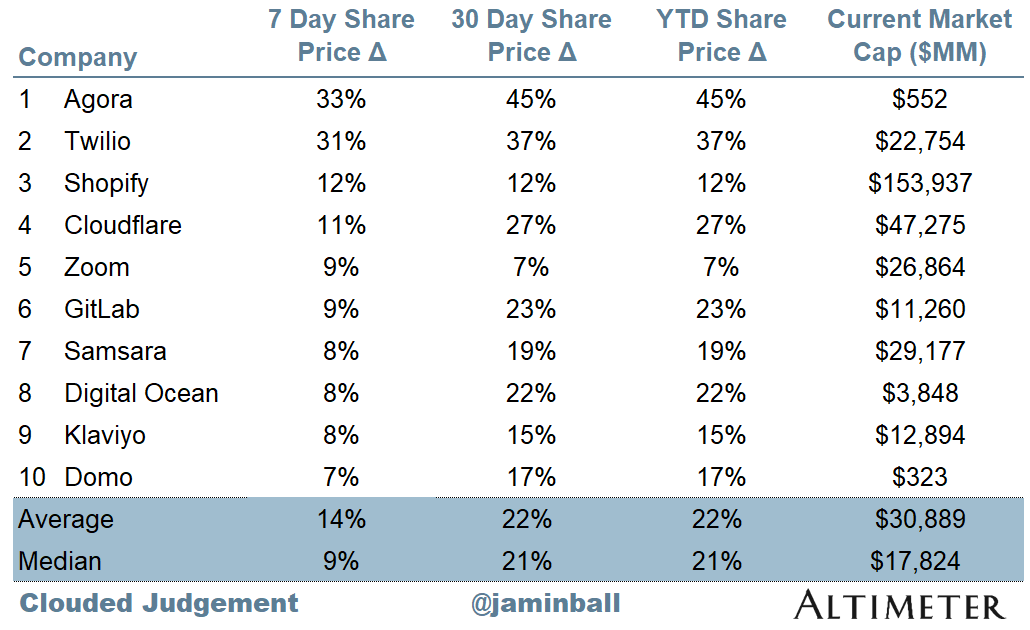
Top 10 Weekly Share Price Movement
Update on Multiples
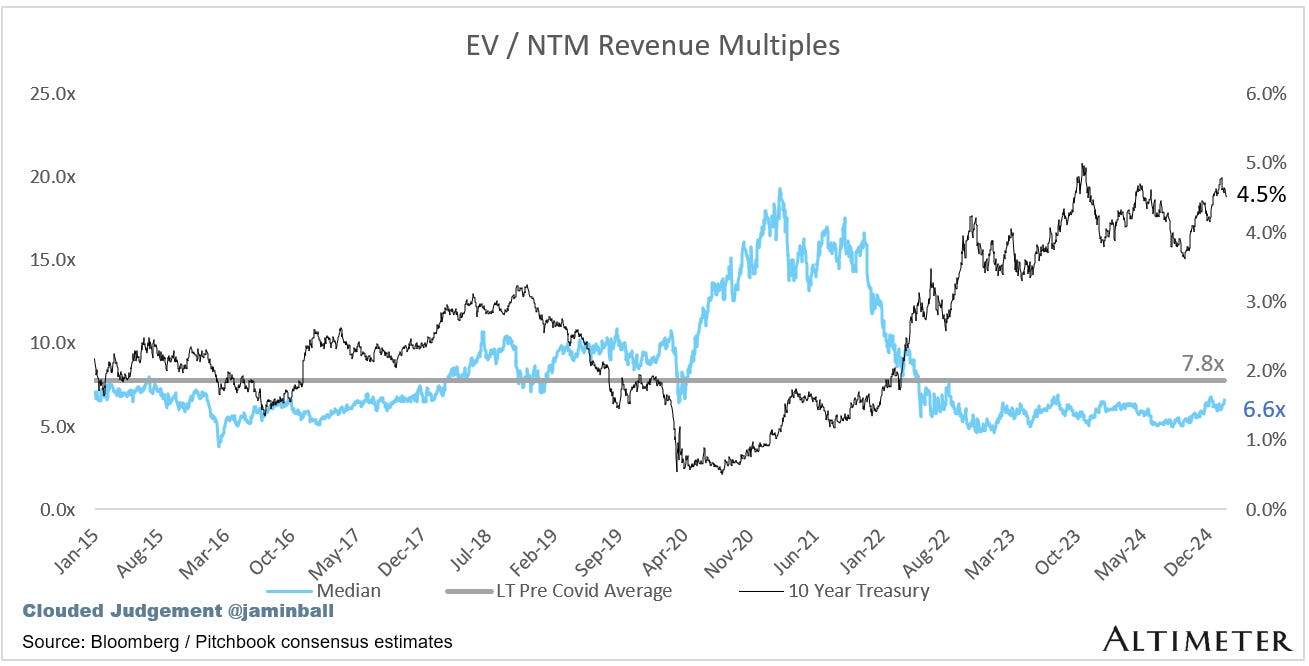
SaaS businesses are generally valued on a multiple of their revenue - in most cases the projected revenue for the next 12 months. Revenue multiples are a shorthand valuation framework. Given most software companies are not profitable, or not generating meaningful FCF, it’s the only metric to compare the entire industry against. Even a DCF is riddled with long term assumptions. The promise of SaaS is that growth in the early years leads to profits in the mature years. Multiples shown below are calculated by taking the Enterprise Value (market cap + debt - cash) / NTM revenue.
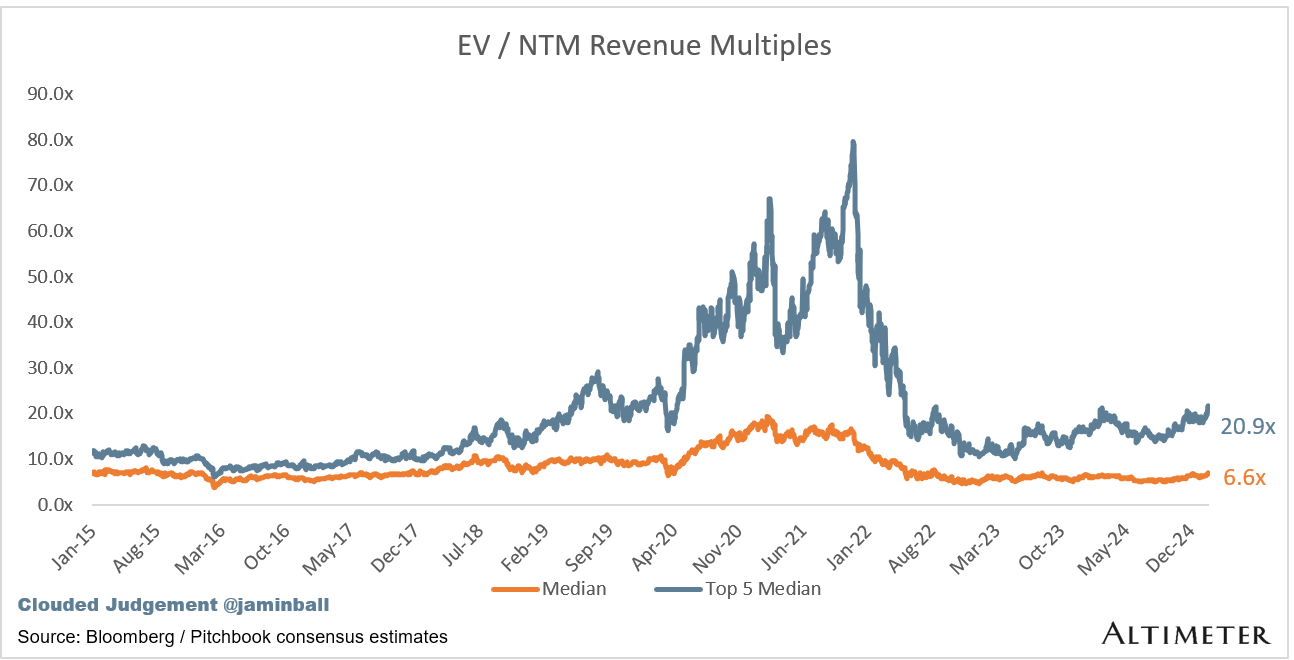
Overall Stats:
Overall Median: 6.6x
Top 5 Median: 20.9x
10Y: 4.5%
Bucketed by Growth. In the buckets below I consider high growth >27% projected NTM growth (I had to update this, as there’s only 1 company projected to grow >30% after this quarter’s earnings), mid growth 15%-27% and low growth <15%
High Growth Median: 11.1x
Mid Growth Median: 11.9x
Low Growth Median: 4.6x

EV / NTM Rev / NTM Growth
The below chart shows the EV / NTM revenue multiple divided by NTM consensus growth expectations. So a company trading at 20x NTM revenue that is projected to grow 100% would be trading at 0.2x. The goal of this graph is to show how relatively cheap / expensive each stock is relative to their growth expectations


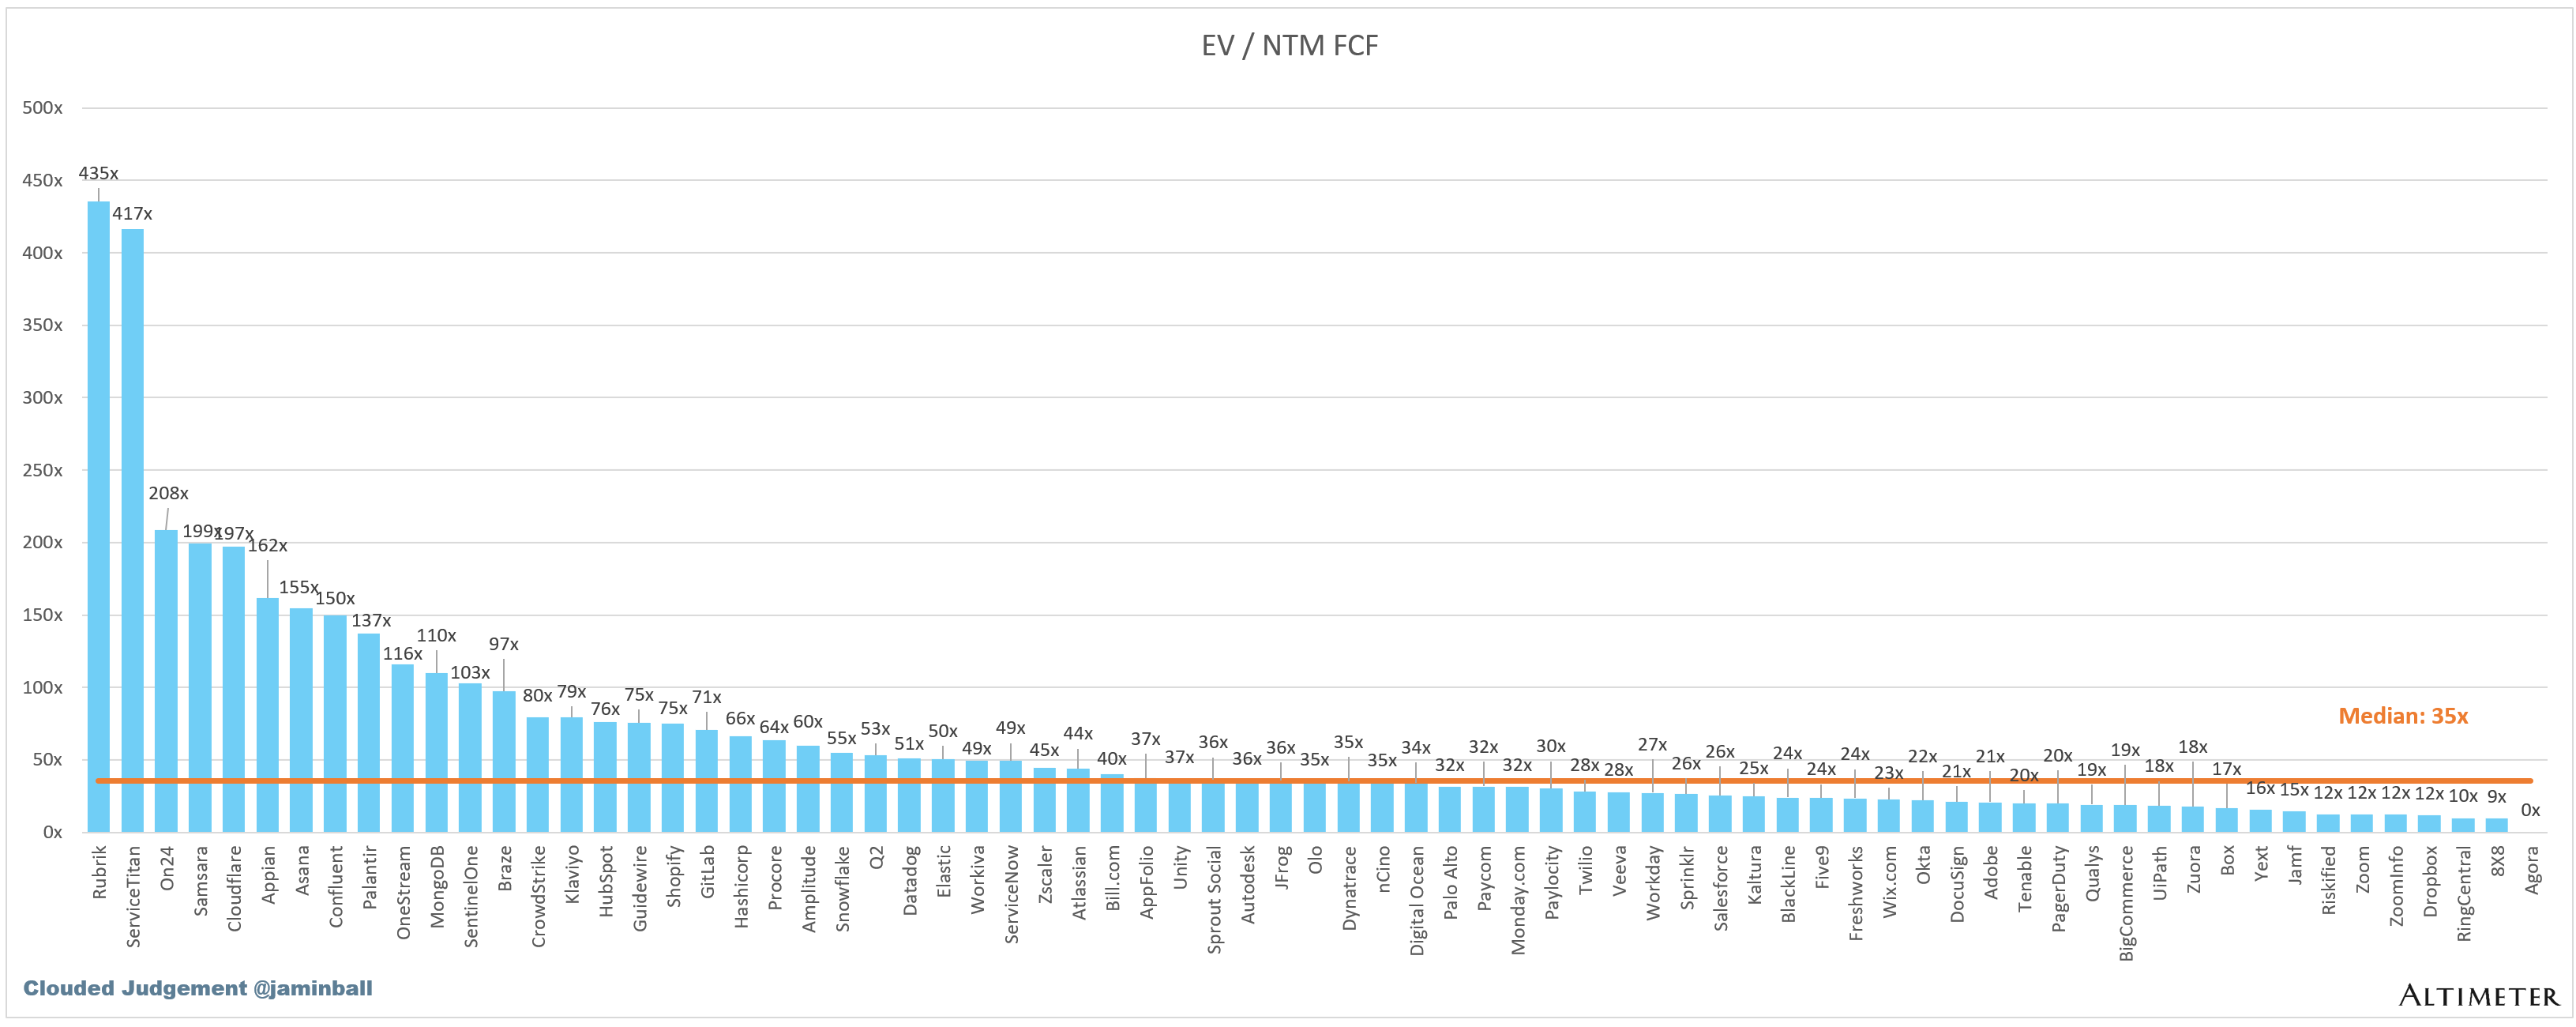
EV / NTM FCF
The line chart shows the median of all companies with a FCF multiple >0x and <100x. I created this subset to show companies where FCF is a relevant valuation metric.

Companies with negative NTM FCF are not listed on the chart
Scatter Plot of EV / NTM Rev Multiple vs NTM Rev Growth
How correlated is growth to valuation multiple?

Operating Metrics
Median NTM growth rate: 12%
Median LTM growth rate: 14%
Median Gross Margin: 76%
Median Operating Margin (7%)
Median FCF Margin: 16%
Median Net Retention: 109%
Median CAC Payback: 37 months
Median S&M % Revenue: 39%
Median R&D % Revenue: 25%
Median G&A % Revenue: 17%
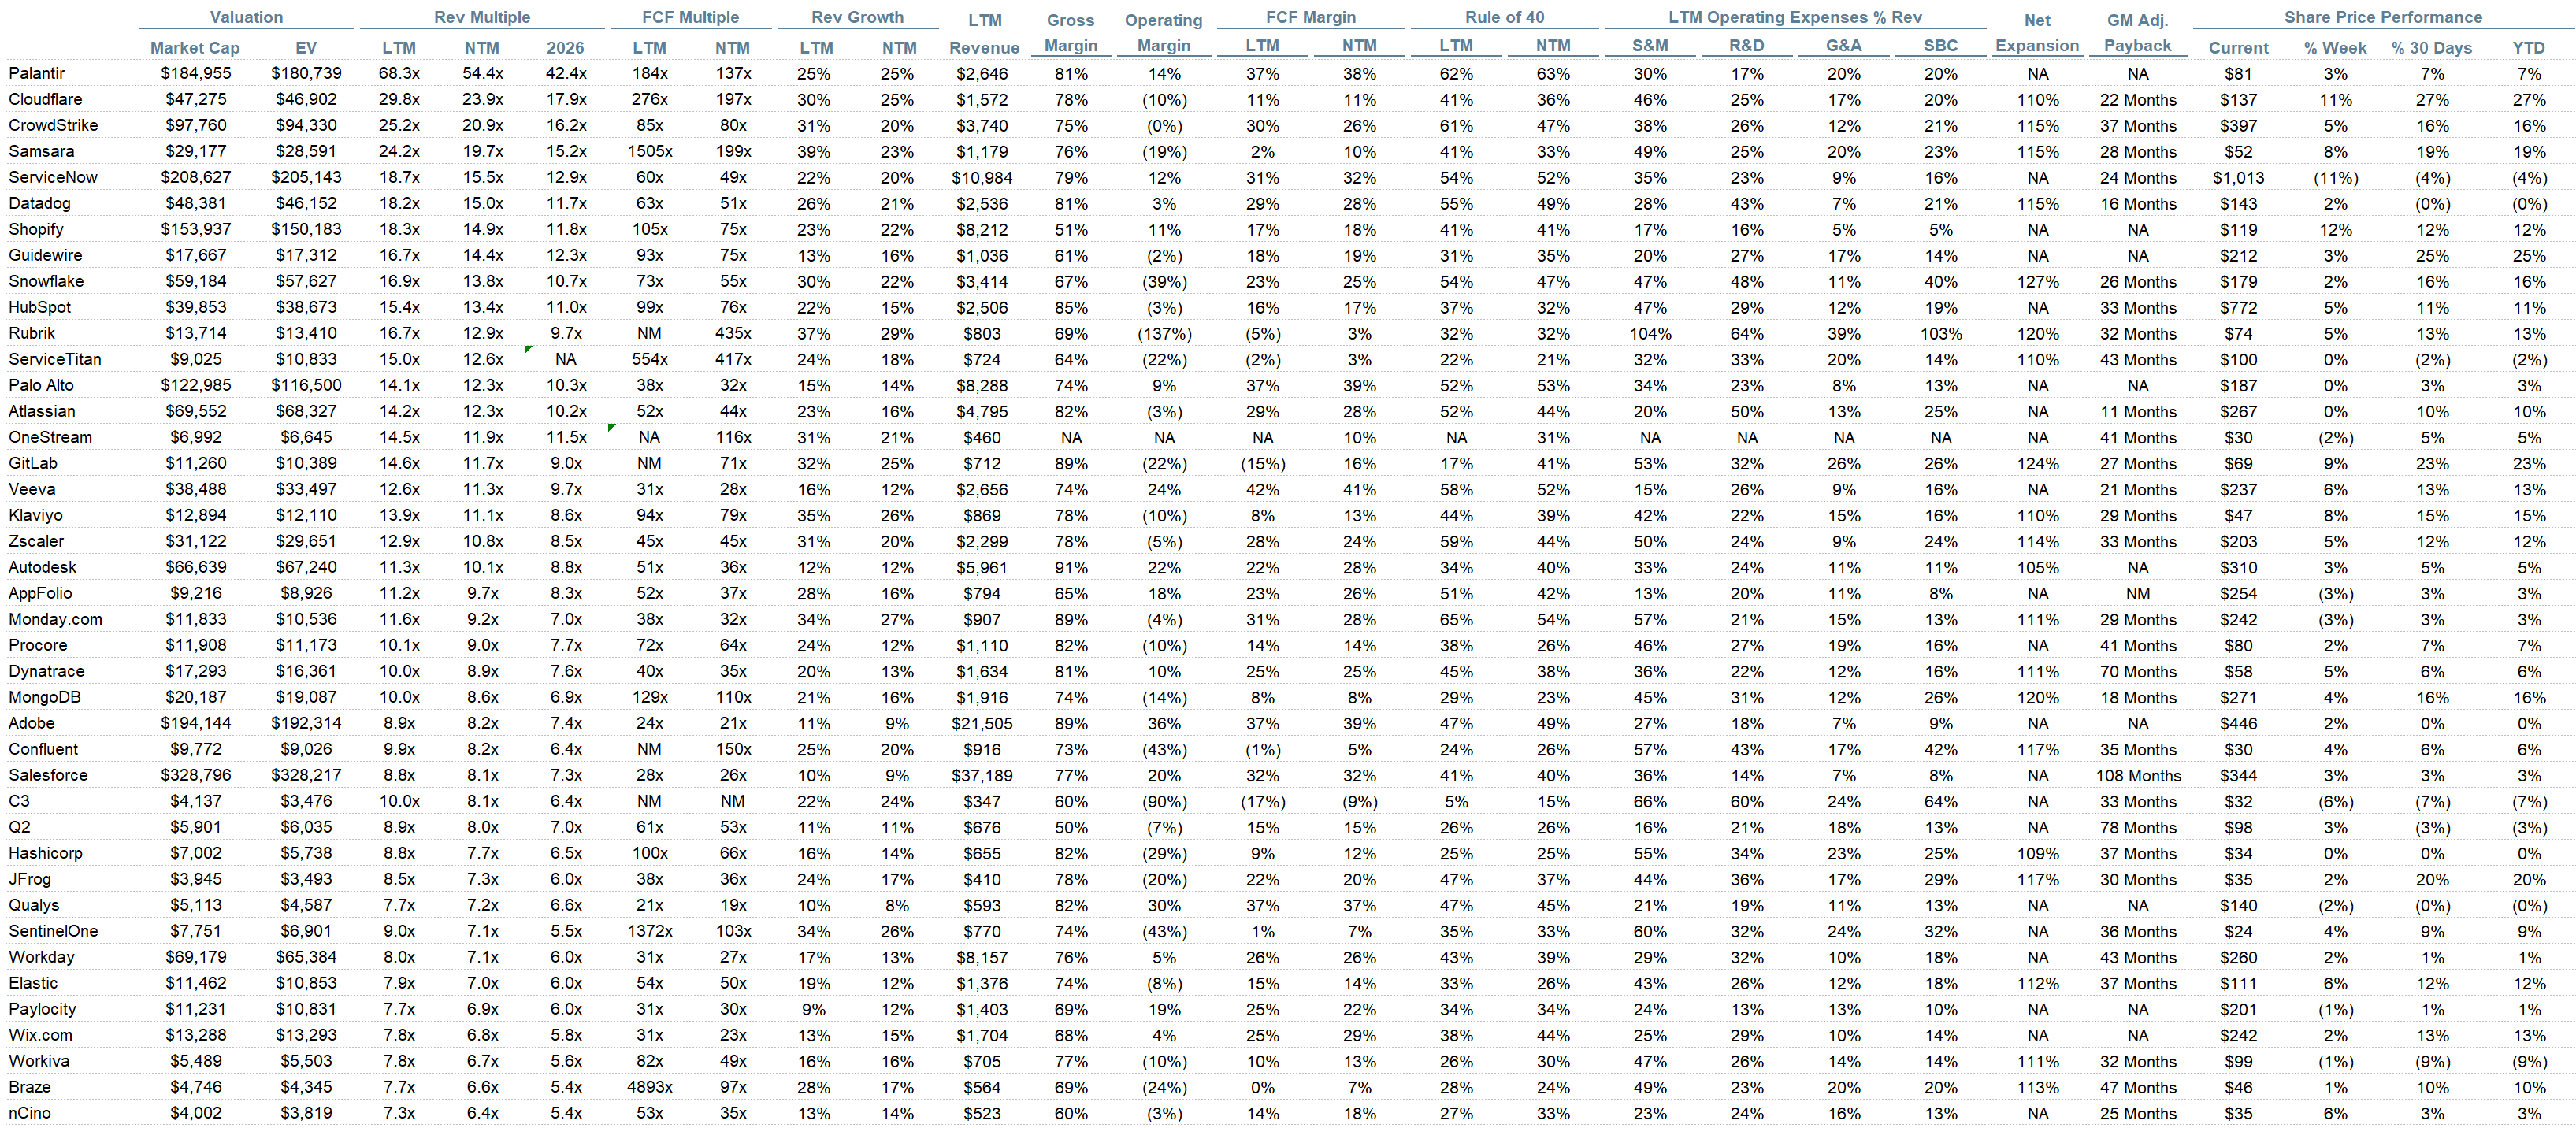
Comps Output
Rule of 40 shows rev growth + FCF margin (both LTM and NTM for growth + margins). FCF calculated as Cash Flow from Operations - Capital Expenditures
GM Adjusted Payback is calculated as: (Previous Q S&M) / (Net New ARR in Q x Gross Margin) x 12 . It shows the number of months it takes for a SaaS business to payback their fully burdened CAC on a gross profit basis. Most public companies don’t report net new ARR, so I’m taking an implied ARR metric (quarterly subscription revenue x 4). Net new ARR is simply the ARR of the current quarter, minus the ARR of the previous quarter. Companies that do not disclose subscription rev have been left out of the analysis and are listed as NA.

Sources used in this post include Bloomberg, Pitchbook and company filings
The information presented in this newsletter is the opinion of the author and does not necessarily reflect the view of any other person or entity, including Altimeter Capital Management, LP ("Altimeter"). The information provided is believed to be from reliable sources but no liability is accepted for any inaccuracies. This is for information purposes and should not be construed as an investment recommendation. Past performance is no guarantee of future performance. Altimeter is an investment adviser registered with the U.S. Securities and Exchange Commission. Registration does not imply a certain level of skill or training.
This post and the information presented are intended for informational purposes only. The views expressed herein are the author’s alone and do not constitute an offer to sell, or a recommendation to purchase, or a solicitation of an offer to buy, any security, nor a recommendation for any investment product or service. While certain information contained herein has been obtained from sources believed to be reliable, neither the author nor any of his employers or their affiliates have independently verified this information, and its accuracy and completeness cannot be guaranteed. Accordingly, no representation or warranty, express or implied, is made as to, and no reliance should be placed on, the fairness, accuracy, timeliness or completeness of this information. The author and all employers and their affiliated persons assume no liability for this information and no obligation to update the information or analysis contained herein in the future.
Thanks, Jamin. What are your current thoughts on the impact of AI/agents on per seat pricing models beyond the costs of LLMs/inference? Do you see this as a non factor in the sense companies will generally hire the same amount of people, but be able to grow much faster through these tools/efficiency...or will these revenue models need to evolve to consumption or providing agent services/workforces to survive - similar to what Salesforce seems to be doing? I've been conflicted on Atlassian as an example. If the general sentiment is that agents are going to have the most immediate impact on development teams/process, and a lot of that development process is going to be agent based with a human "orchestrator" of sorts, on the surface it feels like a risk to Atlassian's revenue model benefiting from large/growing development teams(per seat $). Appreciate any thoughts on the subject(from anyone here). I've adjusted my portfolios application weighting accordingly for now, but wonder about other points of view. Thanks