
Clouded Judgement 1.30.26 - Software is Dead...Again!

Every week I’ll provide updates on the latest trends in cloud software companies. Follow along to stay up to date!
Software is Dead…Again!
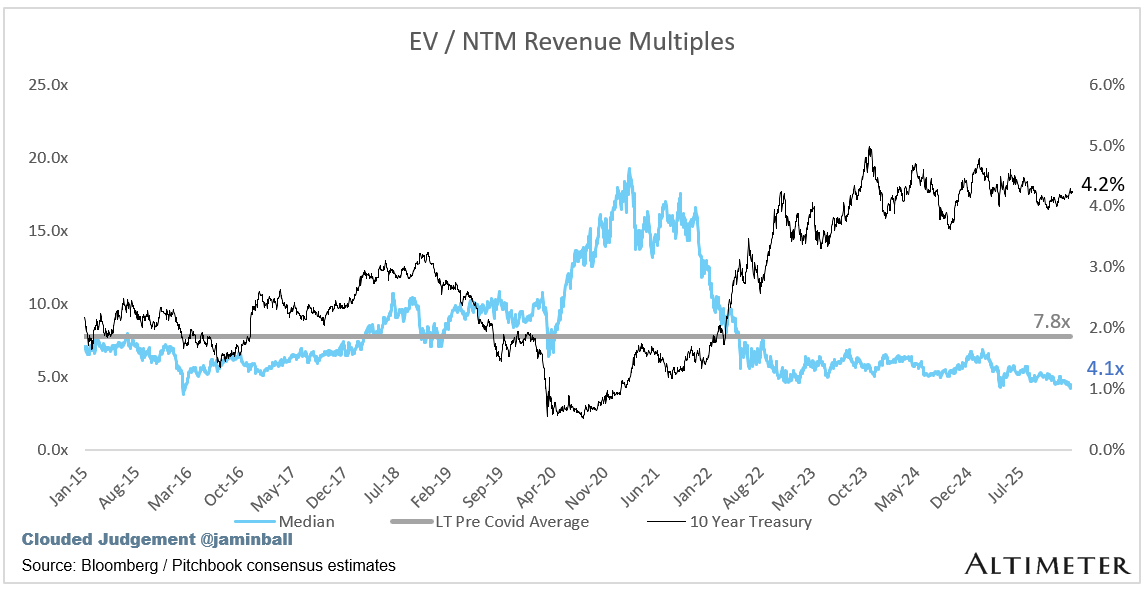
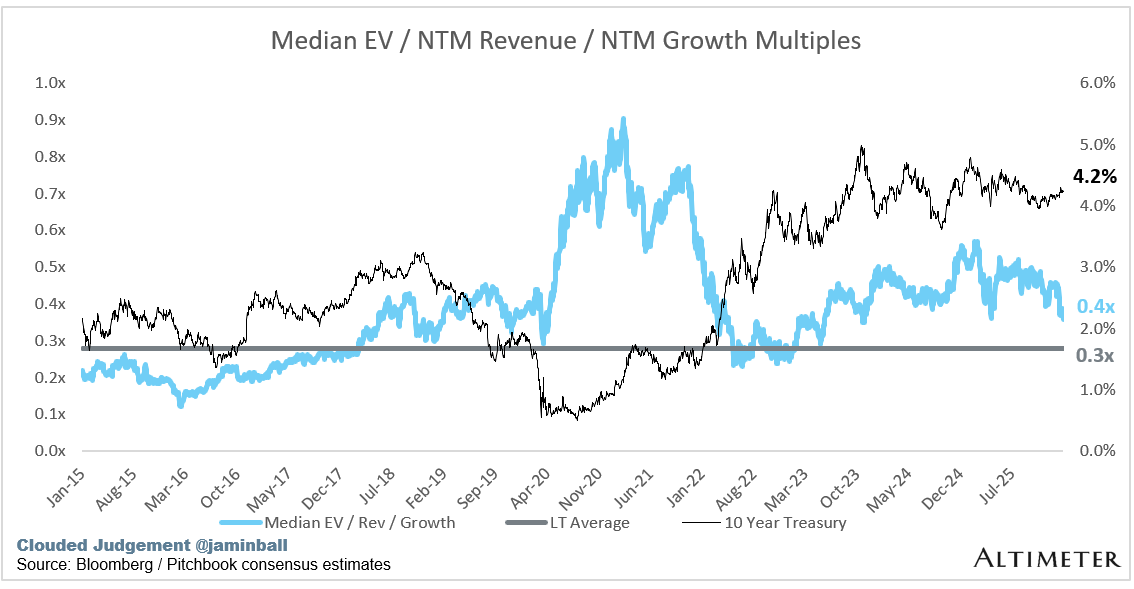
Well, software is dead again! At least investor confidence is dead… The median NTM revenue multiple for the cloud software universe is 4.1x. That’s the lowest it’s been in 10 years (it was about the same very briefly in 2016, when the fed started hiking rates for the first time after the GFC ZIRP period).
The current median FCF multiple is 18.9x. The previous low in the last 10 years was ~26x!
However, the “narrative violation” metric here is the growth adjusted revenue multiple median is still 0.35x vs the pre covid average of 0.28x (you can see the graph below, I post it every week). So while multiples are at historical lows, so are growth rates. The FCF multiple is the most telling, however. With the current median ~30% lower than the prior low point in 2016
So what’s going on?! I think it’s a couple things.
Mainly, confidence in the SaaS business model has shattered. SaaS businesses were long thought of as “cash flow annuities.” Loose money early on, flip profitable, and then every year print cash predictably. You could then calculate the “intrinsic value” of a SaaS business by summing the present value of every annual cash flow, with a terminal value assumption. More specifically, calculate the present value of the next 10 years of cash flows (discounted back to today), and make an assumption of the terminal value (ie year 11 onward).
There are two big assumptions in this kind of analysis (ie a DCF). There are of course more than two, but I’ll call out two main ones.
The first - you are assuming retention rates remain high and stable. You need this to be true in order to predict stable cash flows in that 10 year calculation. If retention rates drop, your cash flows drop precipitously.
Second - you are assuming there IS terminal value! Said another way - you are assuming the terminal value is not 0 :)
So what’s happening right now? Those two big assumptions are being questioned, which is leading to cratering valuations.
AI is creating huge questions about what the future retention rates of these “stable” software companies will be. Software bears will say this platform shift will lead to deteriorating retention rates as companies leave behind legacy SaaS vendors for modern AI native alternatives. At the same time (and related), this is increasing the probability that the terminal value is in fact 0 for some companies.
Regardless of what you believe, the discount rate has gone up. The probability that retention craters, or that the terminal value for some of these companies is actually 0 is higher today that it was a year ago. That SHOULD translate into lower multiples. I will say, I don’t really agree with the “why” this all happened recently. It feels like the prevailing market sentiment is that it will be easy to vibe code replacement software…I don’t buy that for a number of reasons. However, what I think is actually happening is that the marginal cost to create software has cratered. This will certainly lead to an explosion of competition, and an explosion of choice for software buyers. This could certainly put a hamper on future growth as many market become commoditized quickly by a flood of similar looking solutions.
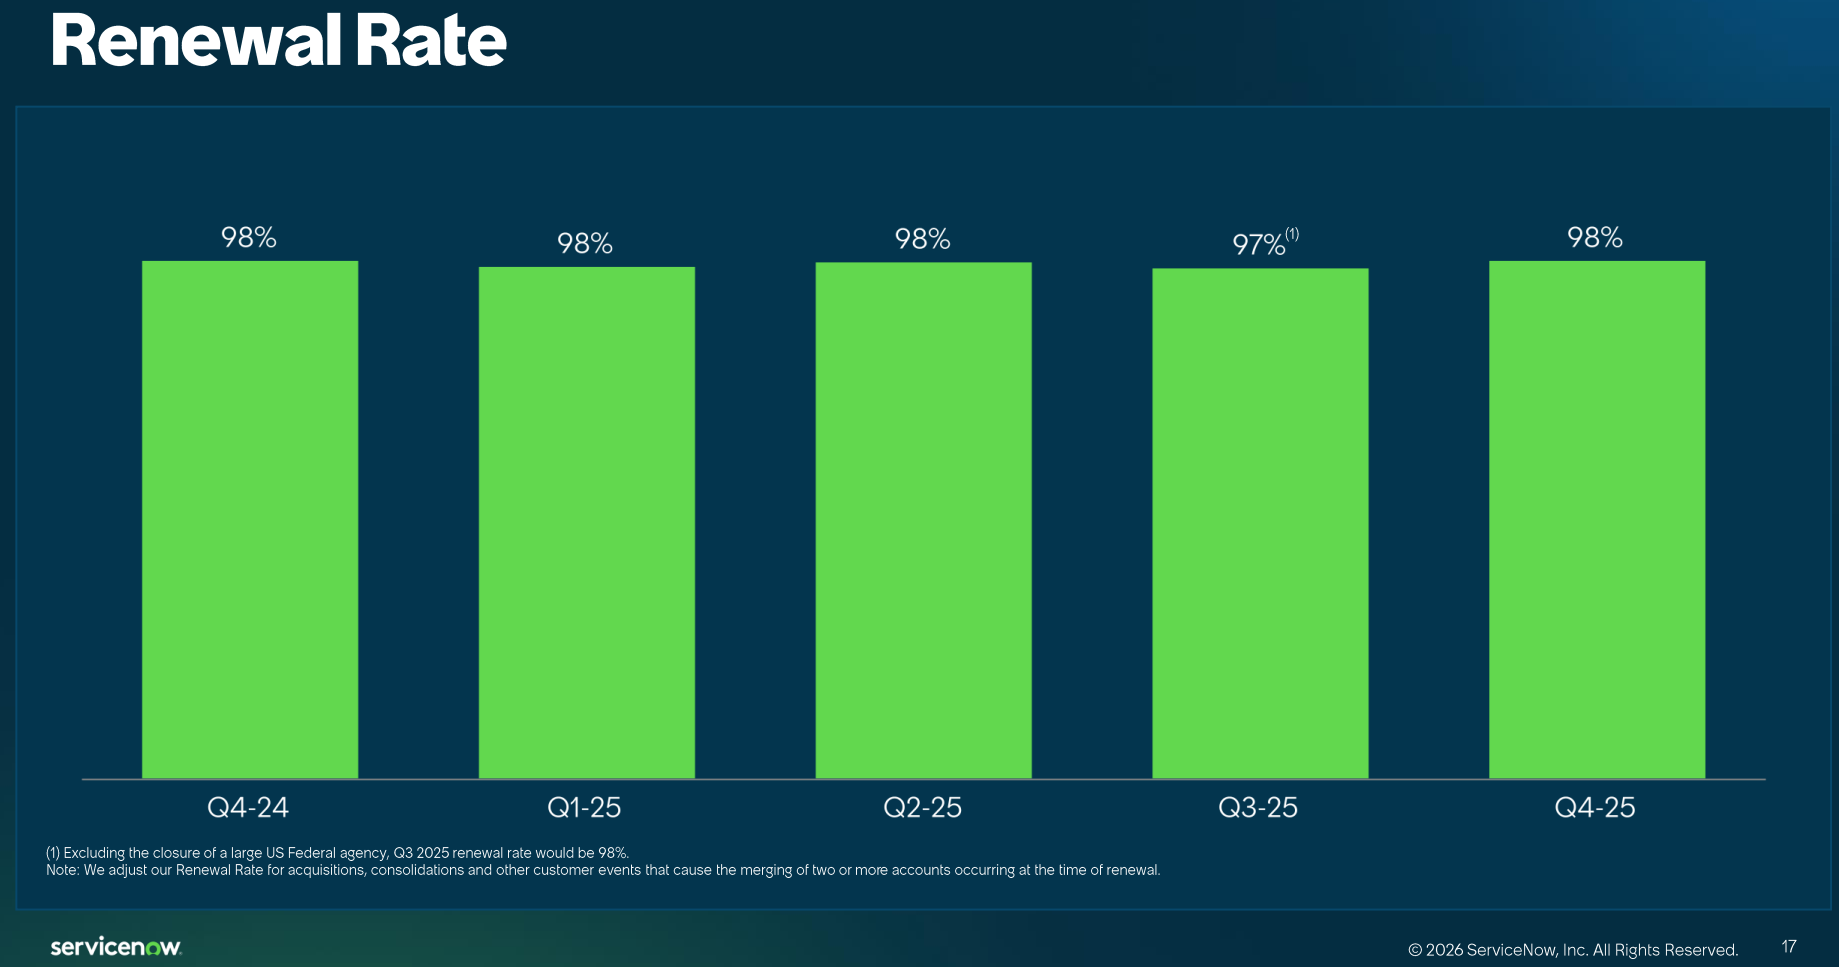
Even if you vehemently disagree with what’s happening in the market today, the real question becomes “what will change the markets mind.” In my opinion it will take a few quarters of showing “stable” retention rates in the face of AI challengers to give the market confidence back. So far we’ve only had a few companies report Q4 earnings. ServiceNow (a stalwart cloud software business) was one of them. Their retention rates haven’t taken a hit yet!
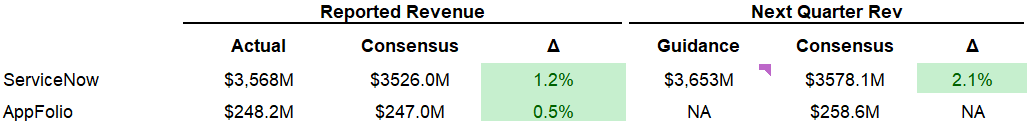
Quarterly Reports Summary
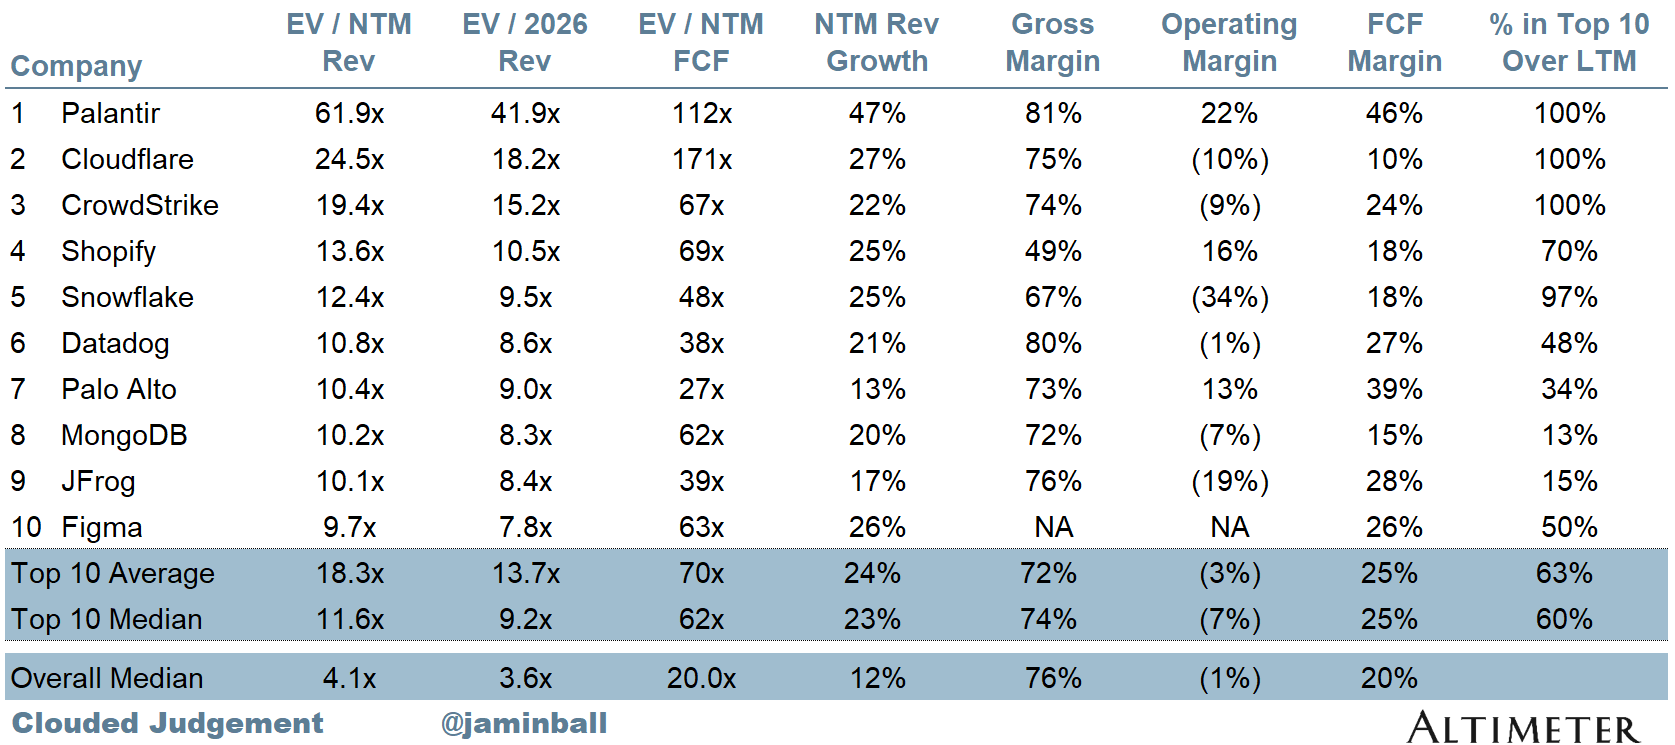
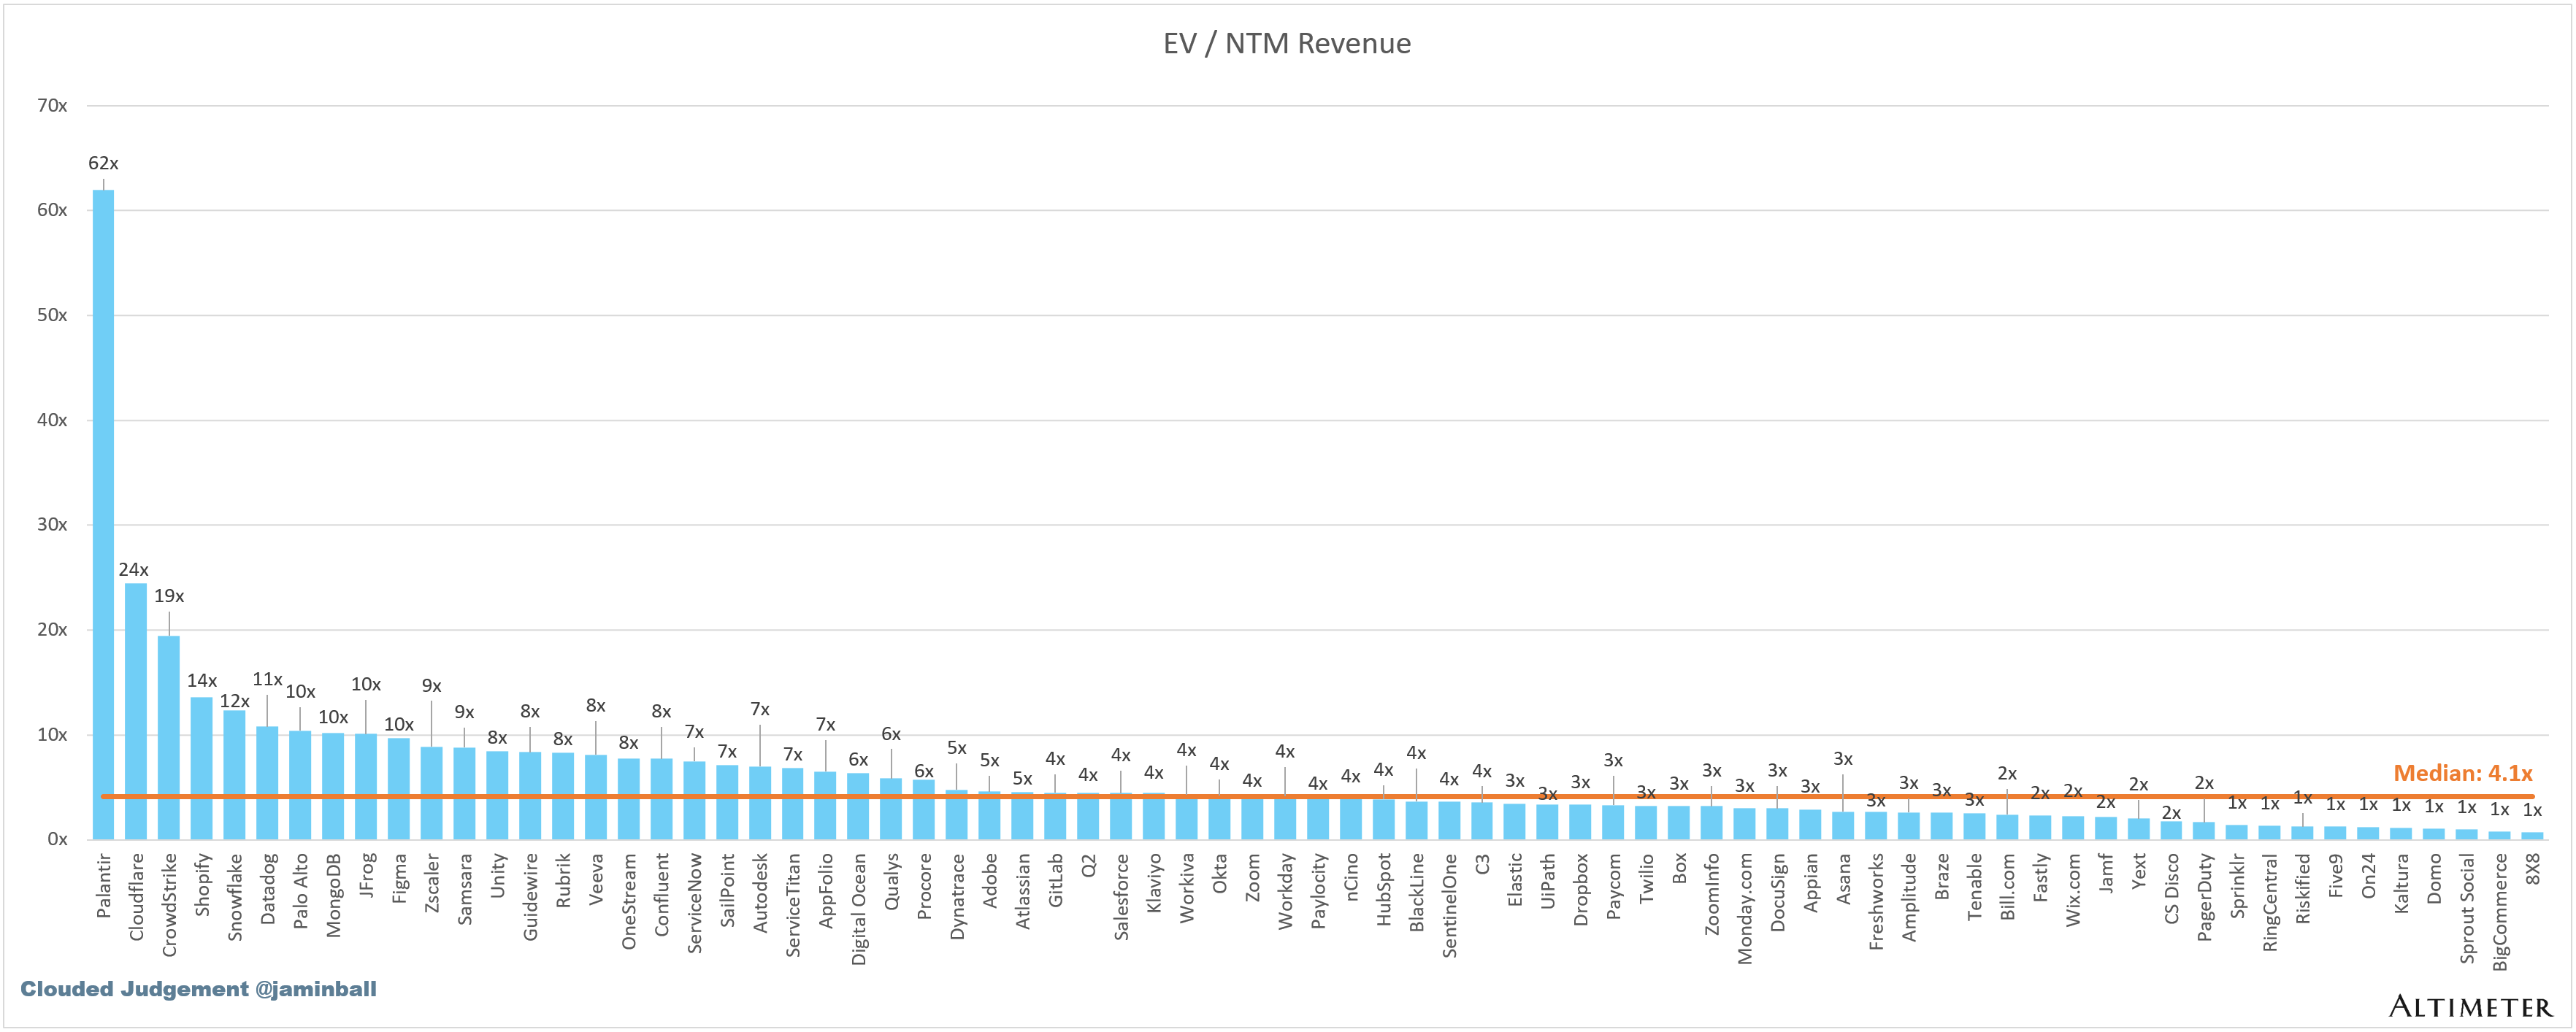
Top 10 EV / NTM Revenue Multiples
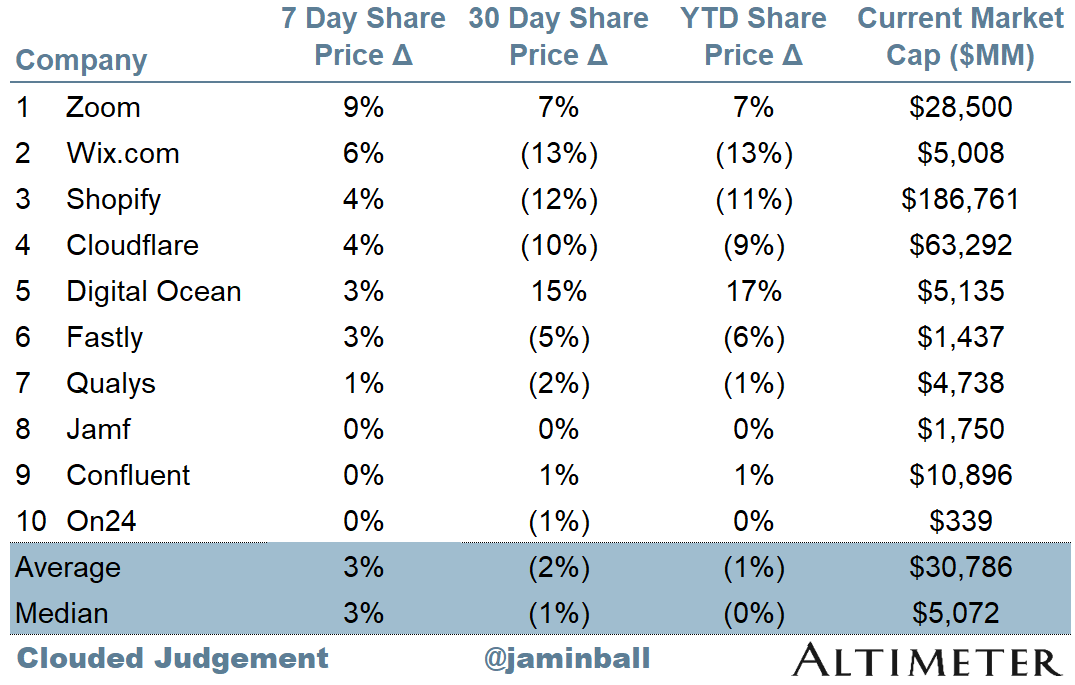
Top 10 Weekly Share Price Movement
Update on Multiples
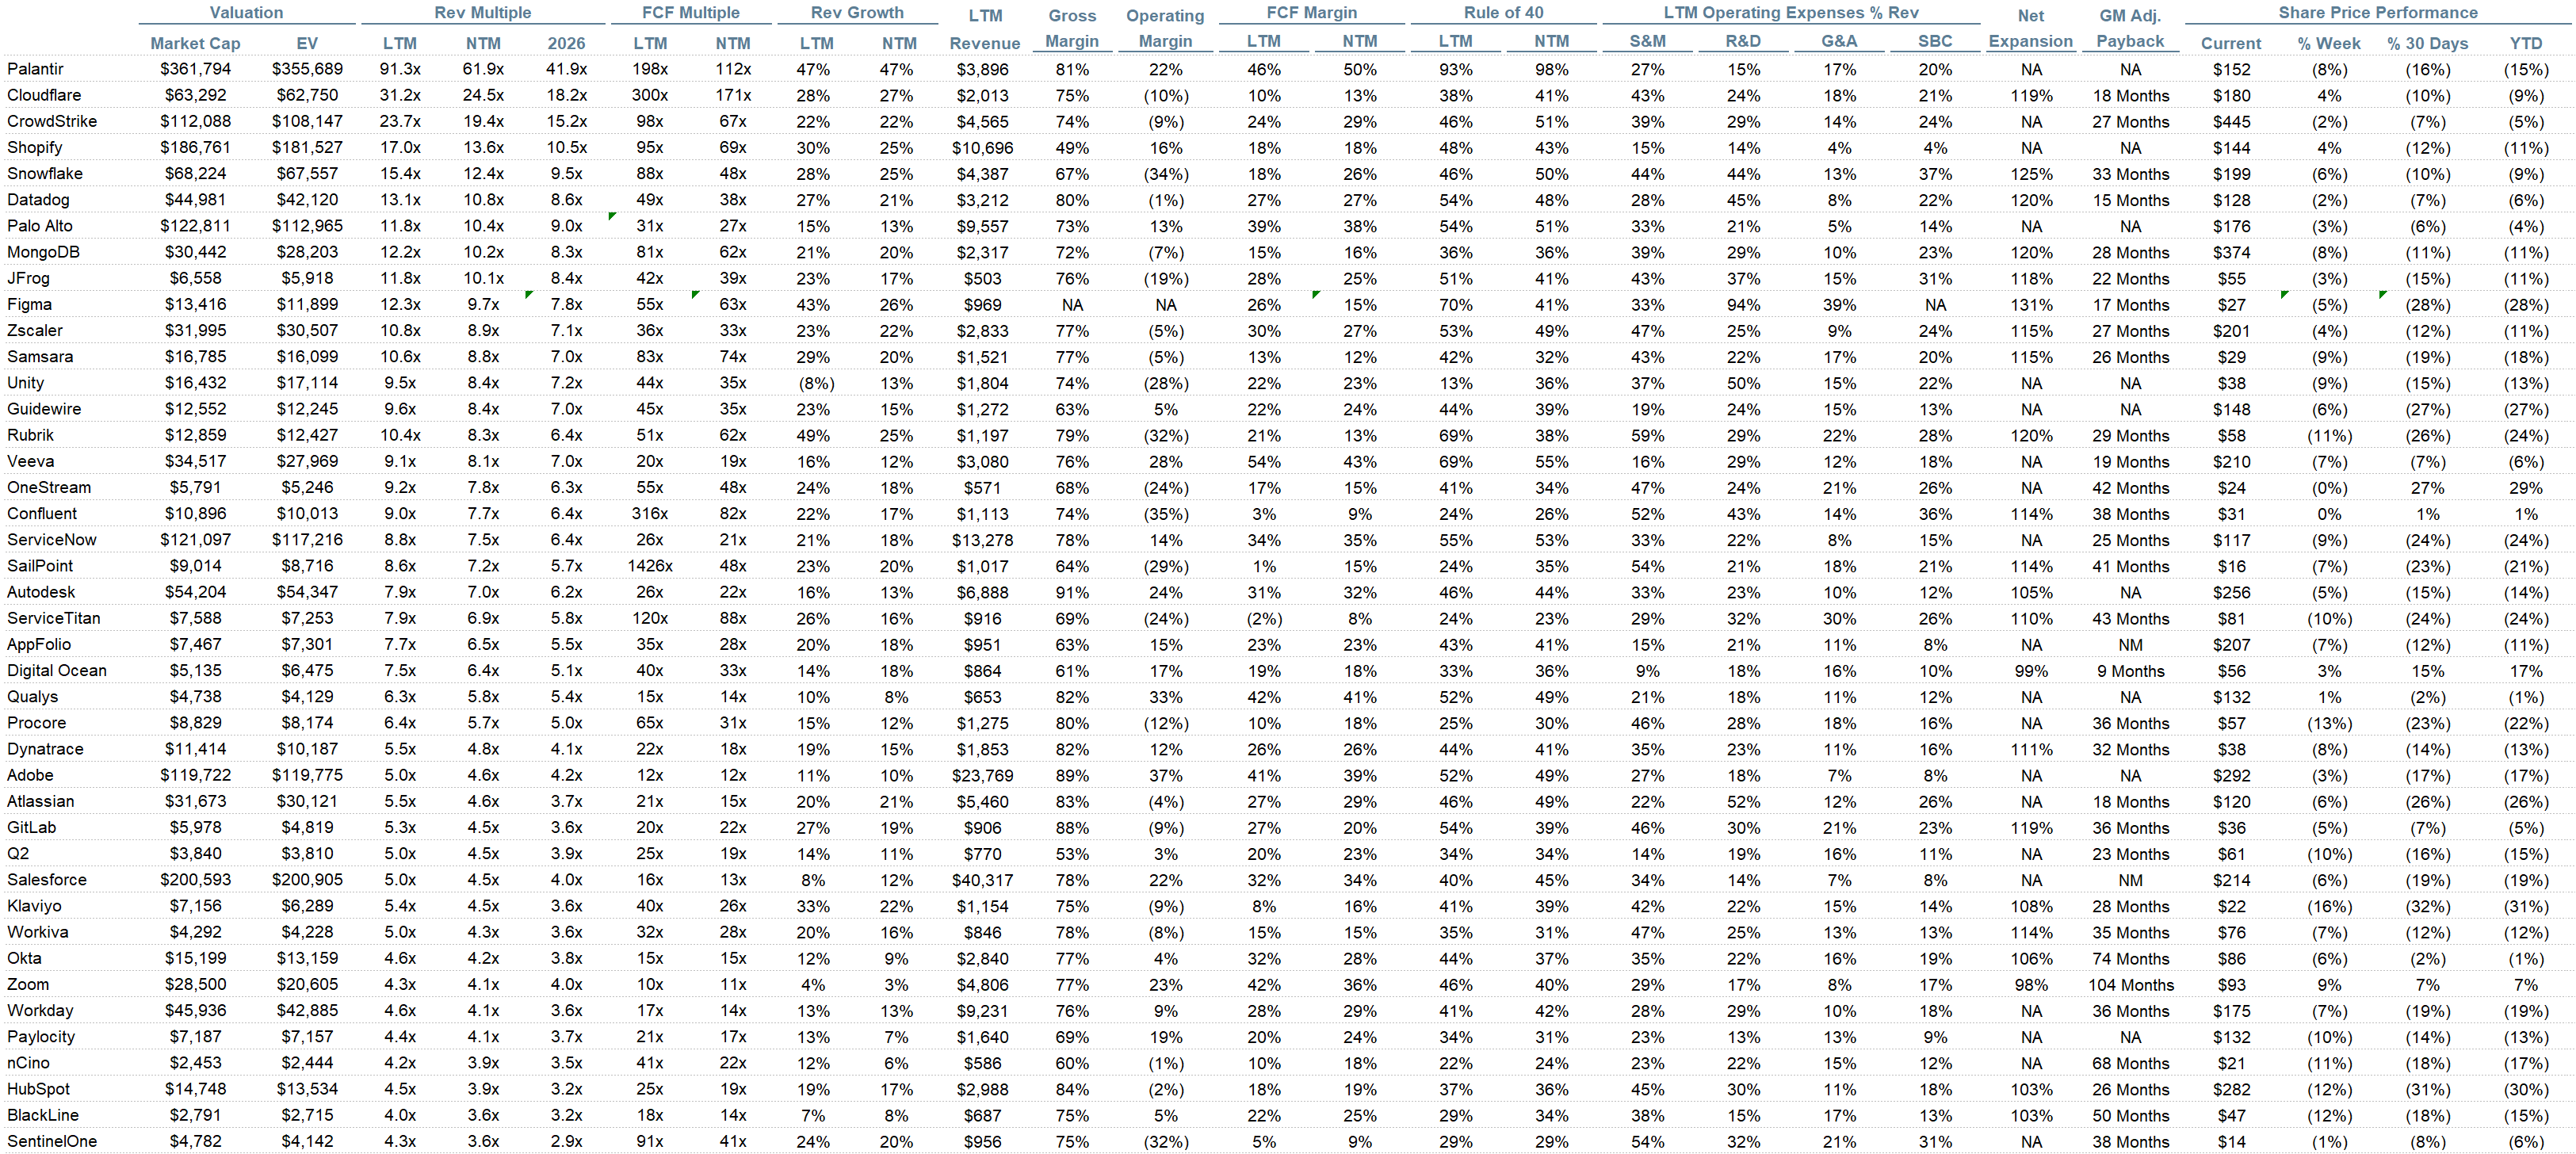
SaaS businesses are generally valued on a multiple of their revenue - in most cases the projected revenue for the next 12 months. Revenue multiples are a shorthand valuation framework. Given most software companies are not profitable, or not generating meaningful FCF, it’s the only metric to compare the entire industry against. Even a DCF is riddled with long term assumptions. The promise of SaaS is that growth in the early years leads to profits in the mature years. Multiples shown below are calculated by taking the Enterprise Value (market cap + debt - cash) / NTM revenue.
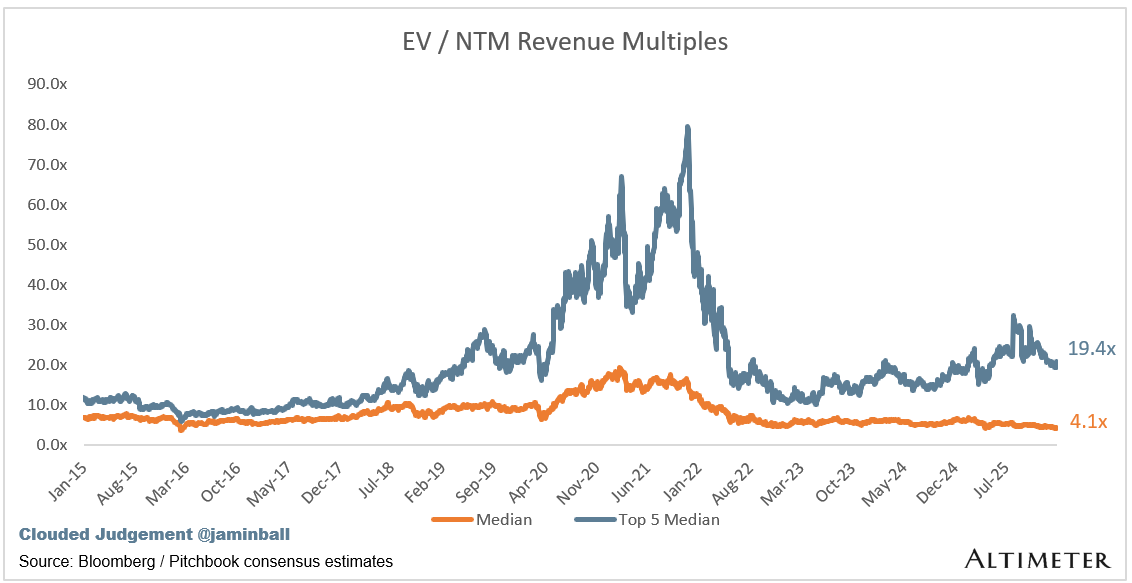
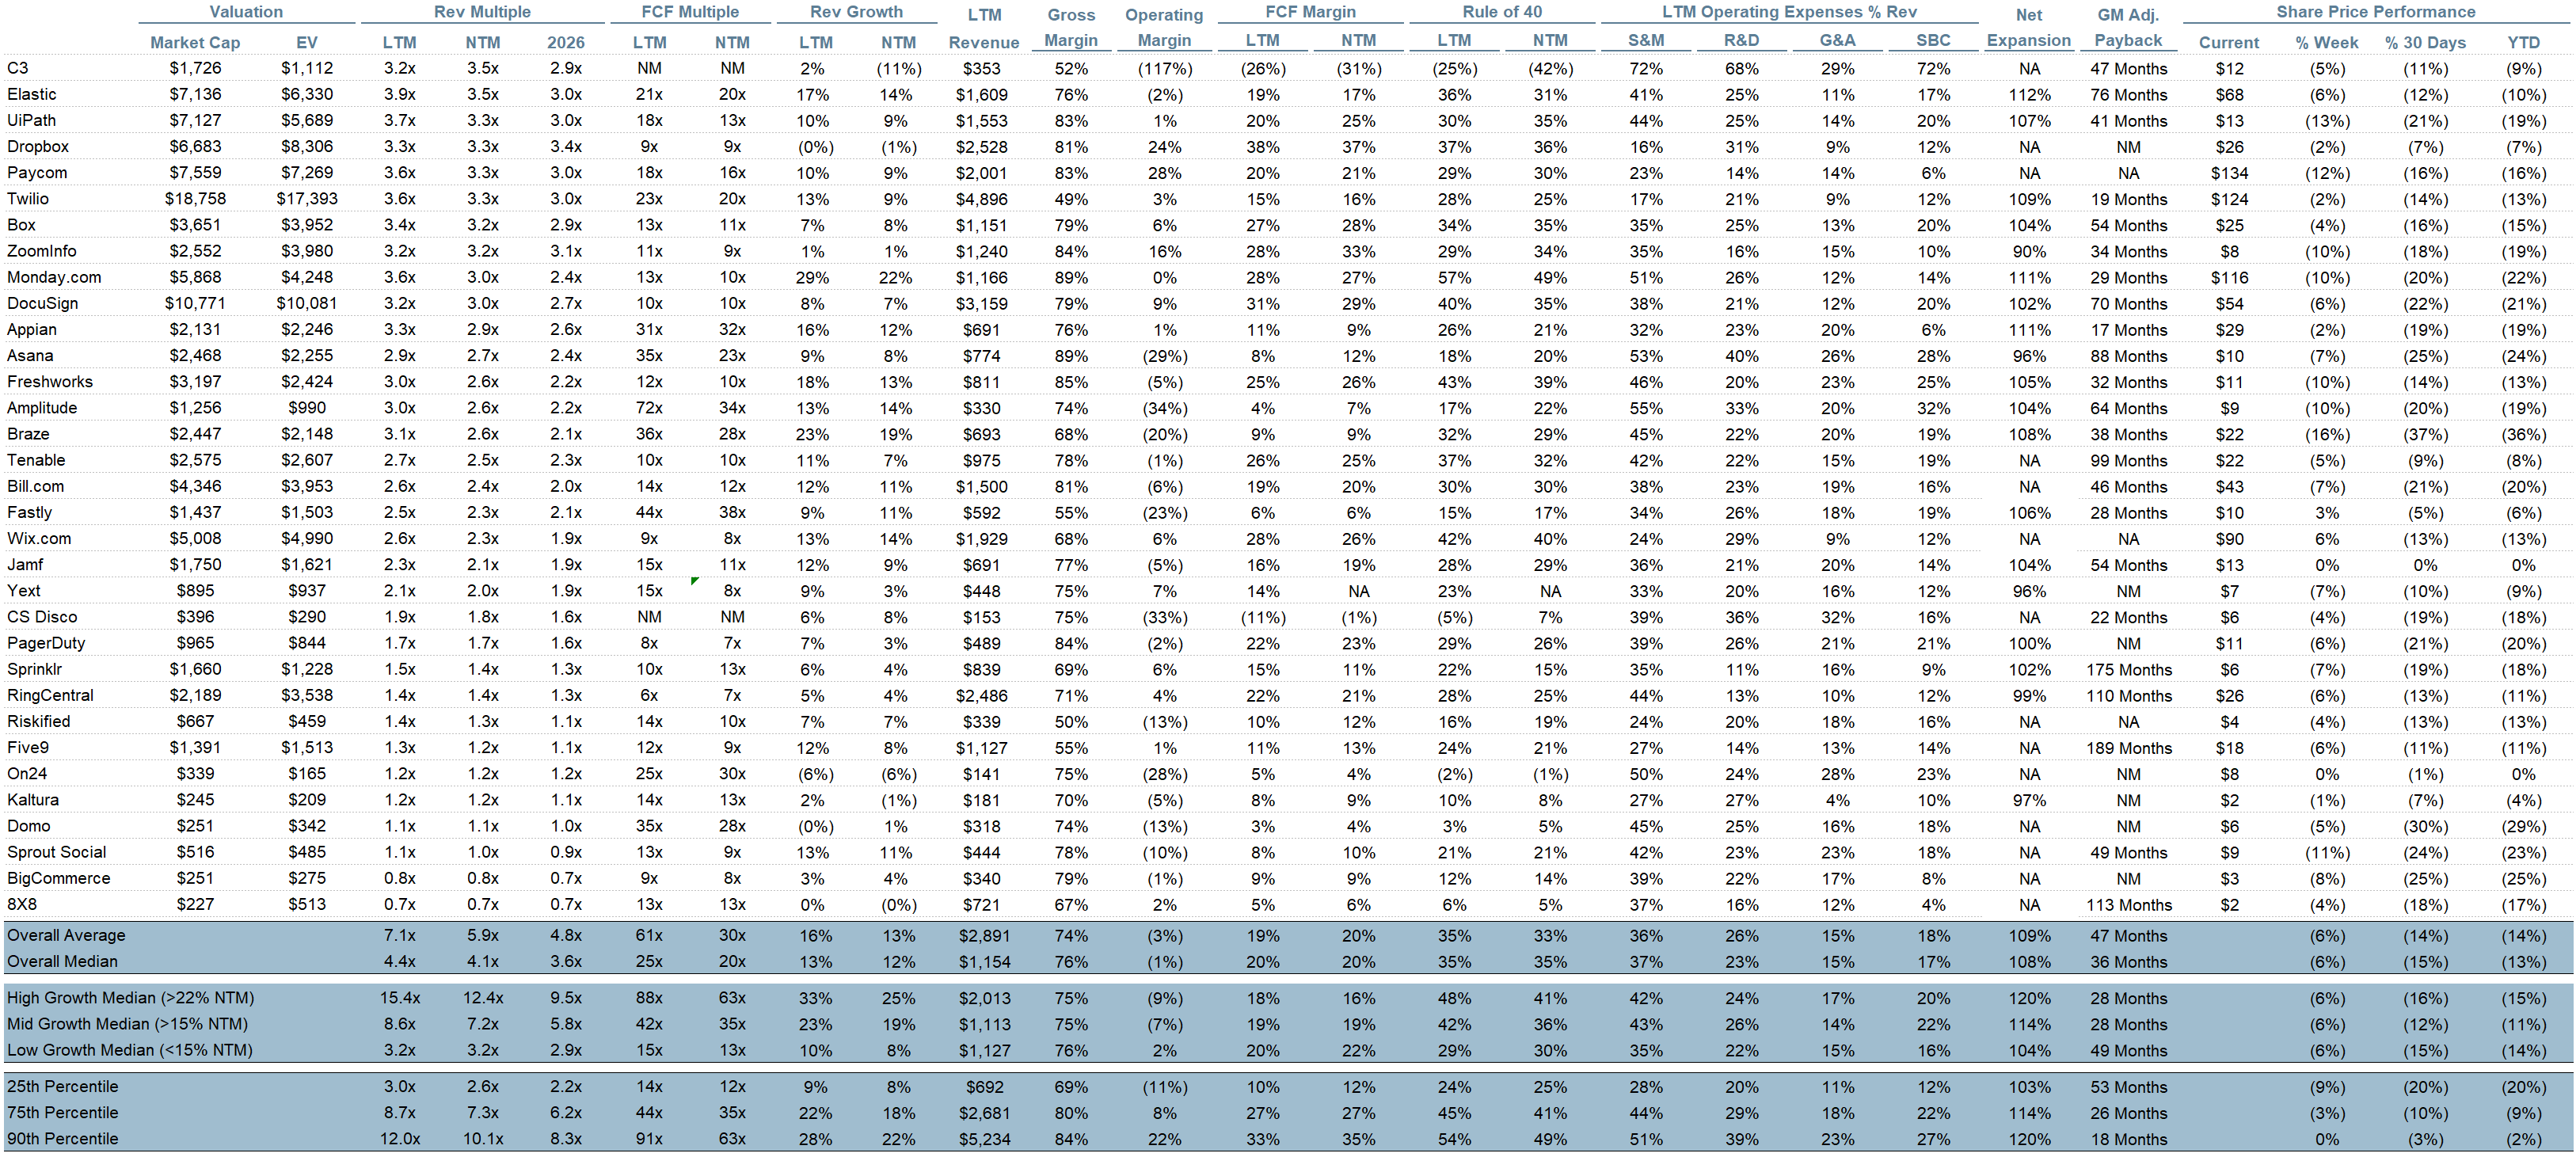
Overall Stats:
Overall Median: 4.1x
Top 5 Median: 19.4x
10Y: 4.2%
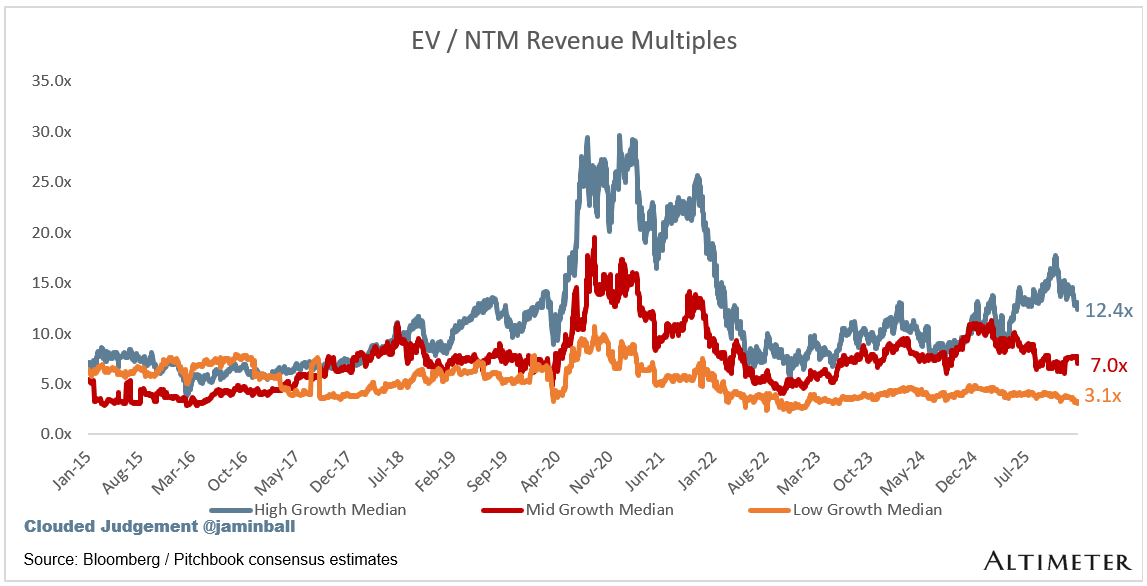
Bucketed by Growth. In the buckets below I consider high growth >22% projected NTM growth, mid growth 15%-22% and low growth <15%. I had to adjusted the cut off for “high growth.” If 22% feels a bit arbitrary, it’s because it is…I just picked a cutoff where there were ~10 companies that fit into the high growth bucket so the sample size was more statistically significant
High Growth Median: 12.4x
Mid Growth Median: 7.0x
Low Growth Median: 3.1x
EV / NTM Rev / NTM Growth
The below chart shows the EV / NTM revenue multiple divided by NTM consensus growth expectations. So a company trading at 20x NTM revenue that is projected to grow 100% would be trading at 0.2x. The goal of this graph is to show how relatively cheap / expensive each stock is relative to its growth expectations.
EV / NTM FCF
The line chart shows the median of all companies with a FCF multiple >0x and <100x. I created this subset to show companies where FCF is a relevant valuation metric.
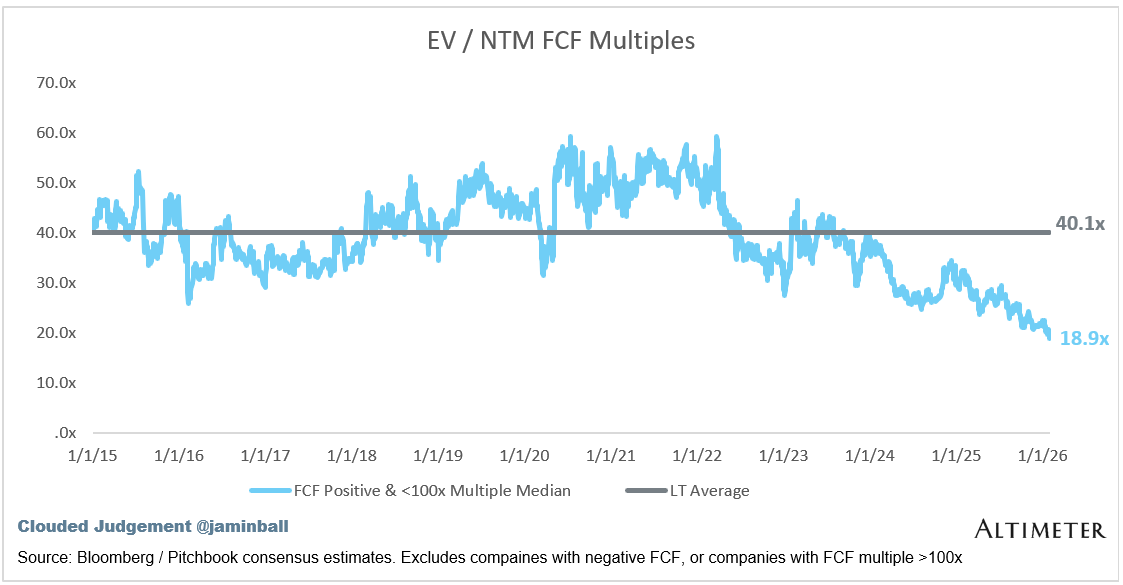
Companies with negative NTM FCF are not listed on the chart
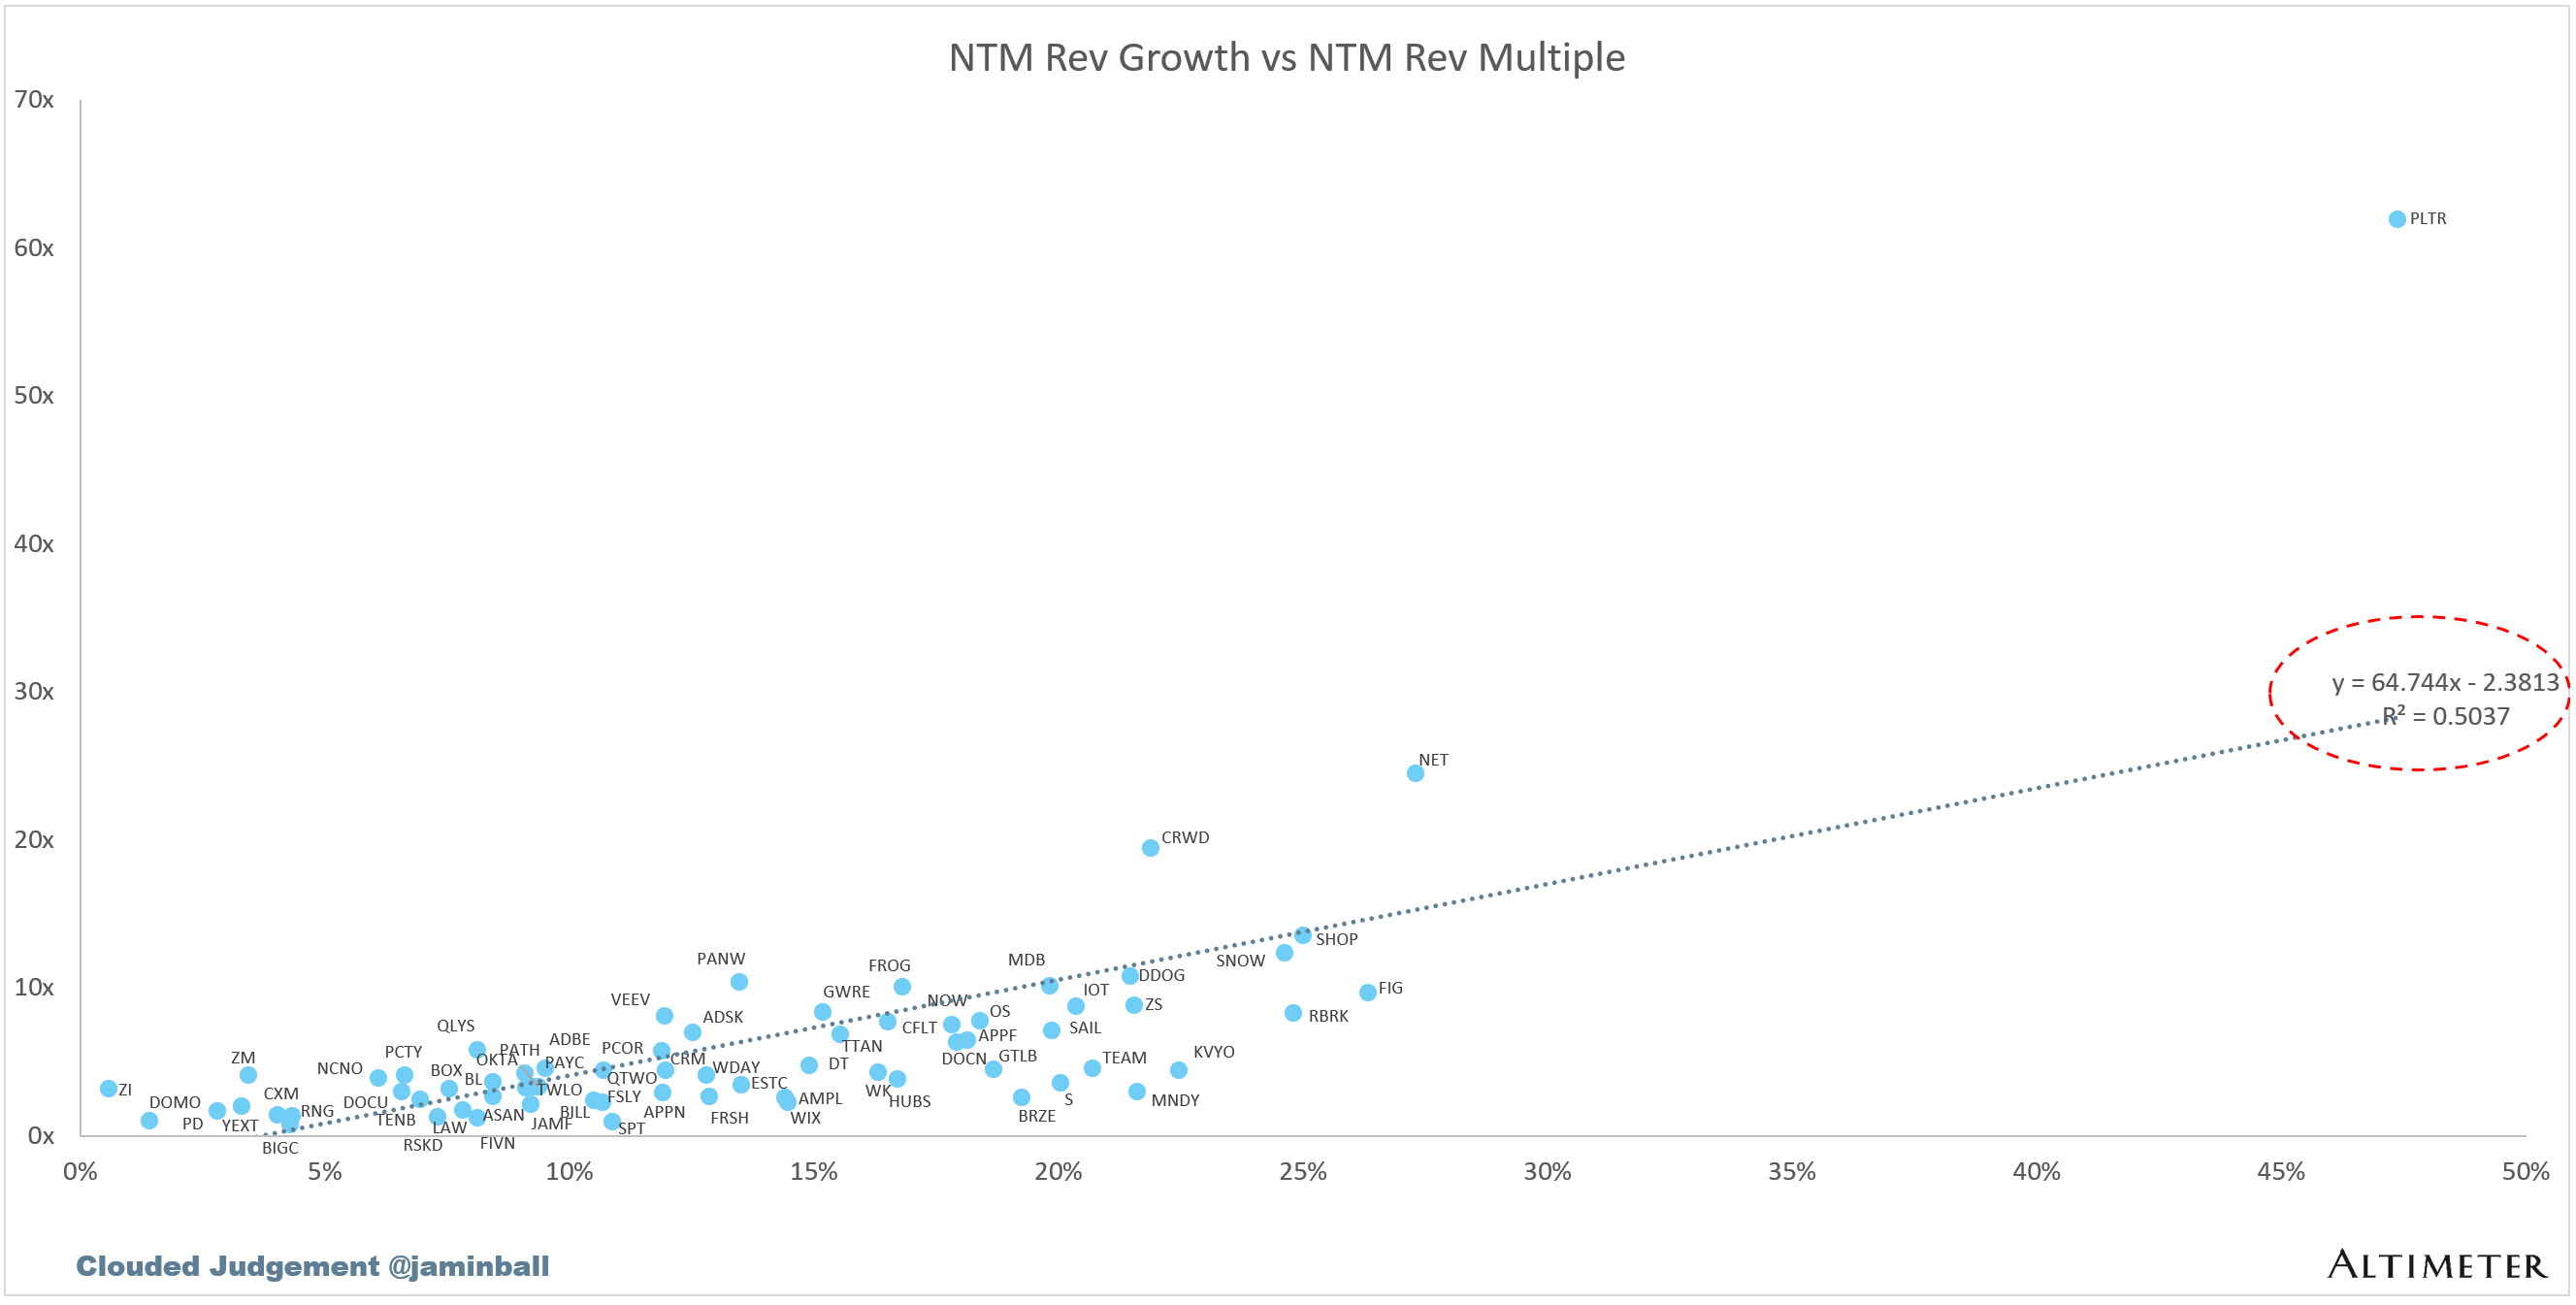
Scatter Plot of EV / NTM Rev Multiple vs NTM Rev Growth
How correlated is growth to valuation multiple?
Operating Metrics
Median NTM growth rate: 12%
Median LTM growth rate: 13%
Median Gross Margin: 76%
Median Operating Margin (1%)
Median FCF Margin: 19%
Median Net Retention: 108%
Median CAC Payback: 36 months
Median S&M % Revenue: 37%
Median R&D % Revenue: 23%
Median G&A % Revenue: 15%
Comps Output
Rule of 40 shows rev growth + FCF margin (both LTM and NTM for growth + margins). FCF calculated as Cash Flow from Operations - Capital Expenditures
GM Adjusted Payback is calculated as: (Previous Q S&M) / (Net New ARR in Q x Gross Margin) x 12. It shows the number of months it takes for a SaaS business to pay back its fully burdened CAC on a gross profit basis. Most public companies don’t report net new ARR, so I’m taking an implied ARR metric (quarterly subscription revenue x 4). Net new ARR is simply the ARR of the current quarter, minus the ARR of the previous quarter. Companies that do not disclose subscription rev have been left out of the analysis and are listed as NA.
Sources used in this post include Bloomberg, Pitchbook and company filings
The information presented in this newsletter is the opinion of the author and does not necessarily reflect the view of any other person or entity, including Altimeter Capital Management, LP (”Altimeter”). The information provided is believed to be from reliable sources but no liability is accepted for any inaccuracies. This is for information purposes and should not be construed as an investment recommendation. Past performance is no guarantee of future performance. Altimeter is an investment adviser registered with the U.S. Securities and Exchange Commission. Registration does not imply a certain level of skill or training. Altimeter and its clients trade in public securities and have made and/or may make investments in or investment decisions relating to the companies referenced herein. The views expressed herein are those of the author and not of Altimeter or its clients, which reserve the right to make investment decisions or engage in trading activity that would be (or could be construed as) consistent and/or inconsistent with the views expressed herein.
This post and the information presented are intended for informational purposes only. The views expressed herein are the author’s alone and do not constitute an offer to sell, or a recommendation to purchase, or a solicitation of an offer to buy, any security, nor a recommendation for any investment product or service. While certain information contained herein has been obtained from sources believed to be reliable, neither the author nor any of his employers or their affiliates have independently verified this information, and its accuracy and completeness cannot be guaranteed. Accordingly, no representation or warranty, express or implied, is made as to, and no reliance should be placed on, the fairness, accuracy, timeliness or completeness of this information. The author and all employers and their affiliated persons assume no liability for this information and no obligation to update the information or analysis contained herein in the future.
Always great analysis Jamin!
Strong take. I agree on the diagnosis. The multiple compression is not about growth alone. It is about broken terminal assumptions.
SaaS was priced like an annuity because retention and relevance were assumed to hold. AI breaks that assumption without requiring a rip-and-replace. Buyers route around tools via agents. Value moves up the stack. Retention metrics lag this shift.
The real change is marginal cost plus competition. Software creation costs collapsed. Differentiation compressed. Pricing power leaks even when logos stay.
Stable retention in a quarter or two does not restore confidence. It only delays the question. The market wants proof that AI deepens dependency rather than abstracts it away.
The companies that survive keep authority. Control. Or an integration choke point that agents cannot bypass. Everything else deserves pressure on terminal value.
#ExecLayer ✈️ #FutureOfSoftware