Clouded Judgement 2.17.23 - the "No-Landing," Datadog Quarter, and Some Data Behind Recent Rally
Every week I’ll provide updates on the latest trends in cloud software companies. Follow along to stay up to date!
No Landing
Last week I talked about the hard landing, soft landing, and no landing outcomes. It seems like the incremental data we’ve gotten continue to increase the odds of a “no landing.” I won’t rehash all of the details of a no-landing. But in summary - we can only say we’ve had a soft landing if we can look back in the rearview mirror and say “we’re all good, never ended up having a recession and we ALSO have the all clear that we won’t have one in the future.” The most difficult part of this is getting to the all-clear phase. More likely than not, we don’t have an imminent recession, but also don’t have the all-clear (ie no landing).
Some of the data to support a no-landing. January CPI came in this week, and while it continues to go down, the magnitude of the slowdown isn’t as steep as it’s been in prior months. Retail sales / PPI also came in very hot, supporting the “strong consumer” narrative. What does all of this mean? A likely outcome is the strong consumer / labor market lead to inflation getting “sticky” at a target above the 2% target. So while inflation is coming down now (core inflation peaked at 6.6% and it was 5.6% in Jan), there’s a risk we get to something like 4%, and then struggle to get from 4% to 2%. Larry Summers had an awesome tweet (for any football fans out there):
To make the analogy clear to non-football fans: it’s much easier to get inflation from 6% to 4% than from 4% to 2%.
In a no-landing, the risk is that rates will stay high for longer than anticipated, or additional rates hikes will be required to get the final leg of inflation down to 2%. The current consensus is for 1 more 25bps rate hike and then a pause, but just yesterday the St Louis Fed President Bullard says he wouldn’t rule out supporting a 50bps rate hike in March.
Datadog Quarter
Datadog is one of the software darlings. They are also largely a consumption model and have seen a big slowdown. They just reported Q4 ‘22, and in the full year 2022 they grew 63%. However, they guided for 2023 and called for 23-24% growth. The graph below shows their annual growth (and projected 2023 growth) for the last few years. As you can tell, there’s a BIG drop-off projected in 2023
Like Azure, they called for a big slowdown of consumption trends in the month of December. However they also called out a record new logo ARR quarter. In essence, growth from existing customers is slowing (or going negative) as optimizations continue to work their way through, while new business continues to be quite healthy. With these consumption models, customers usually take a few quarters to ramp, which means new logo growth today will translate to ARR growth 2-4 quarters out. So a positive read on the quarter could be “optimizations stunting growth today, but that headwind will slow down mid-year as most low hanging fruit optimizations complete, at which time the record new logos added now will start showing up in ARR growth leading to a reacceleration of growth in the back half of the year.”
That’s obviously the very positive view, but I think the market was trying to figure out how to read Datadog today. It started down 10%, then actually was trading up for a short period of time, before ending the day down ~7%. Did they kitchen-sink the guide with the most conservative outcome? We’ll see!
Recent Rally
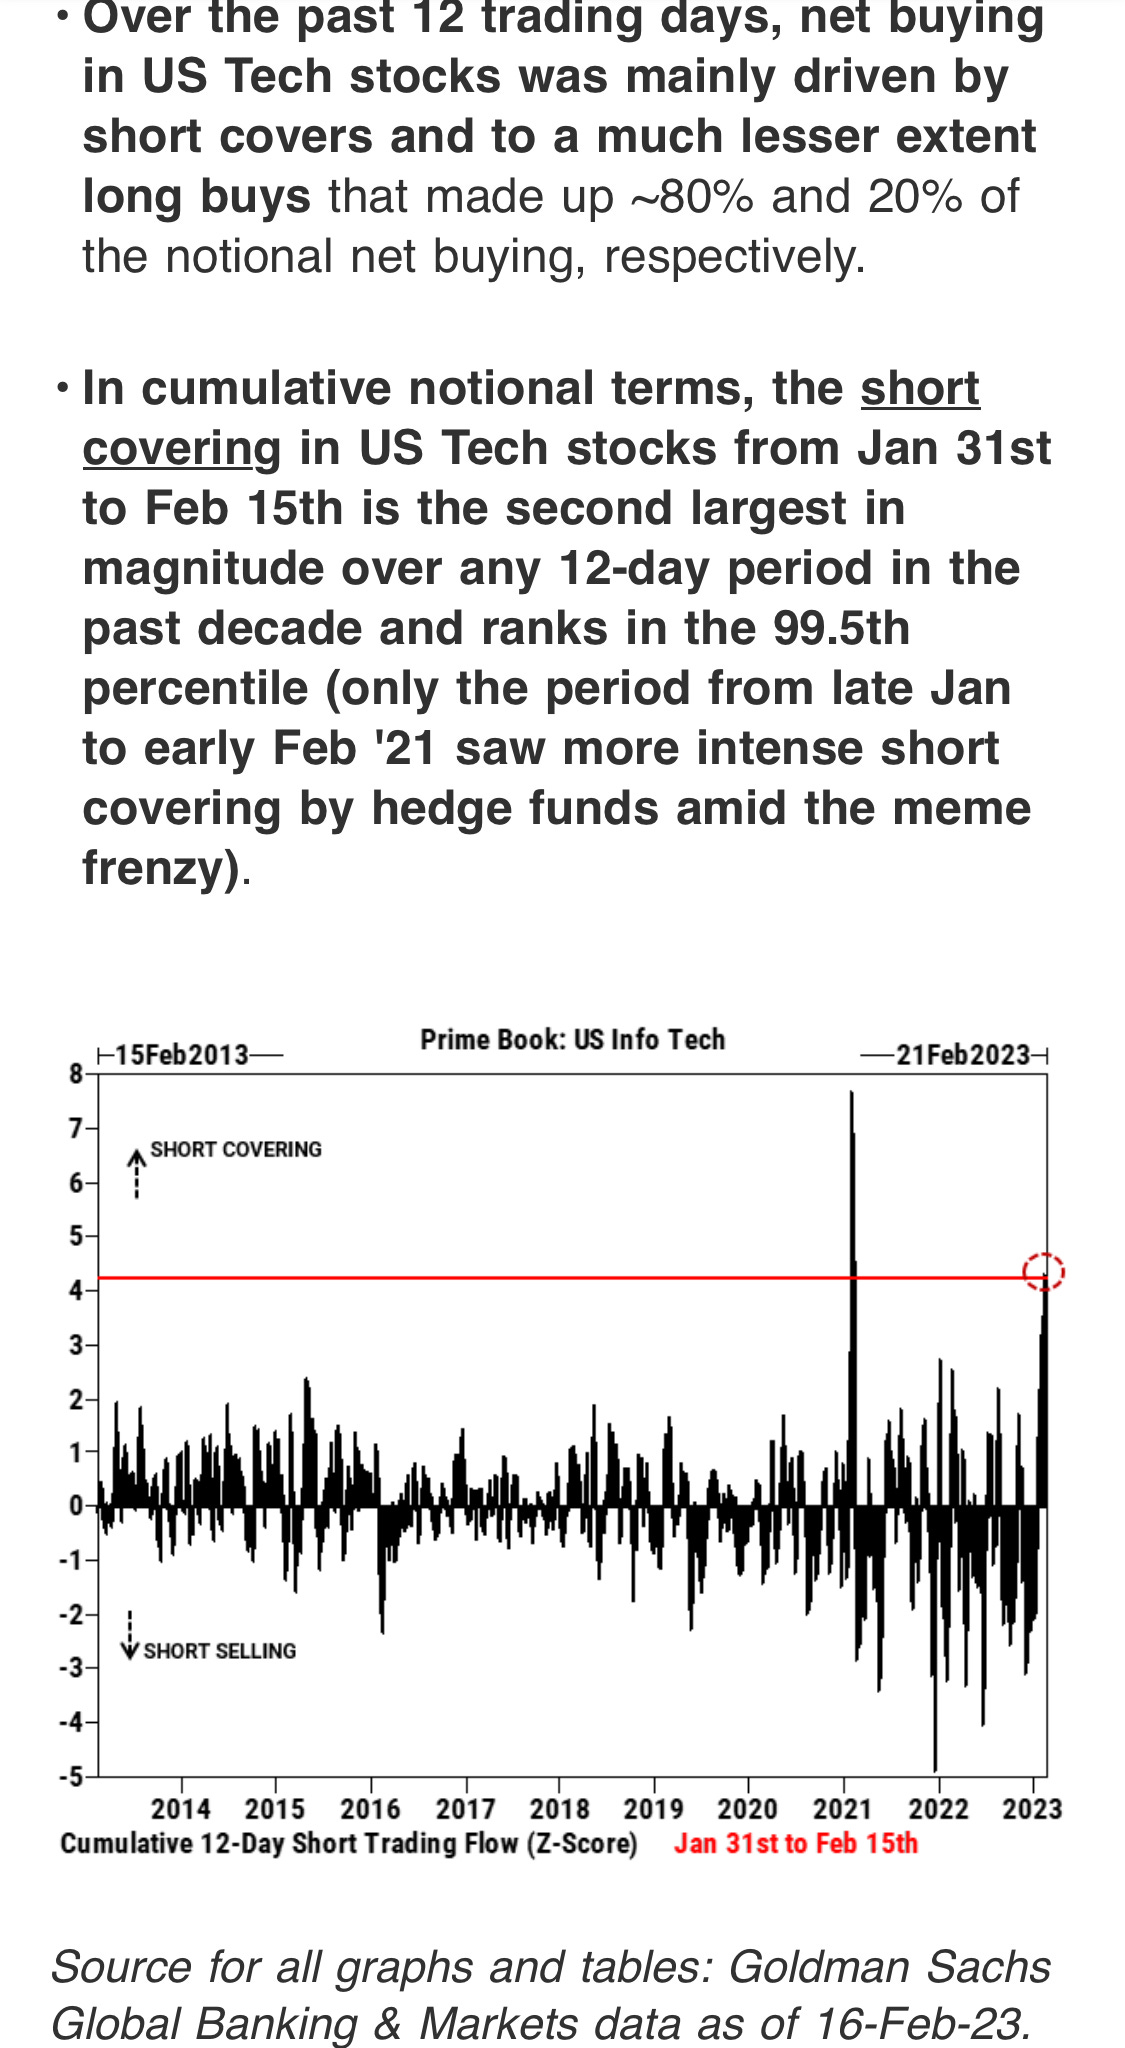
Lots of talk around this, but a big reason for the recent rally over the last couple weeks has been short covering (vs long buying). A note / chart from the Goldman team below:
Quarterly Reports Summary
Top 10 EV / NTM Revenue Multiples
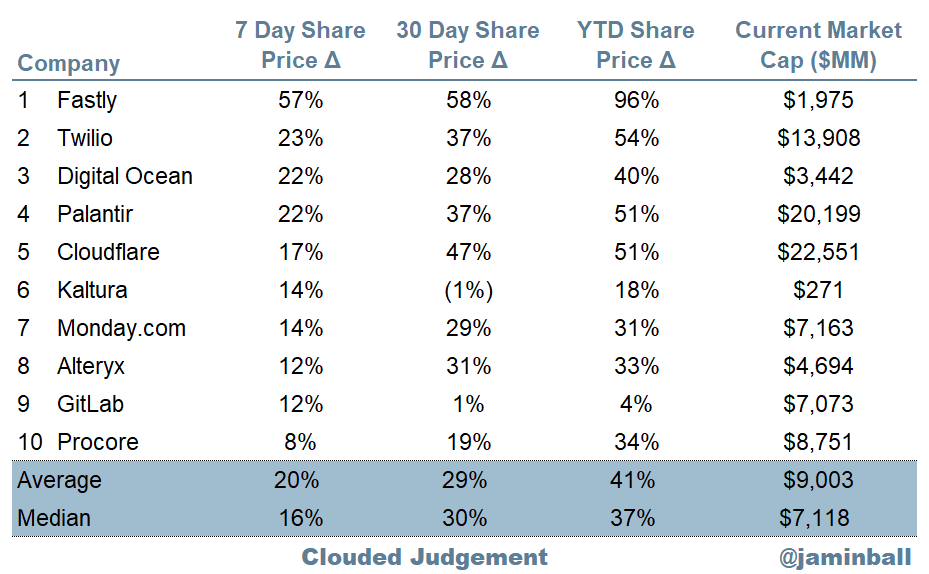
Top 10 Weekly Share Price Movement
Update on Multiples
SaaS businesses are generally valued on a multiple of their revenue - in most cases the projected revenue for the next 12 months. Revenue multiples are a shorthand valuation framework. Given most software companies are not profitable, or not generating meaningful FCF, it’s the only metric to compare the entire industry against. Even a DCF is riddled with long term assumptions. The promise of SaaS is that growth in the early years leads to profits in the mature years. Multiples shown below are calculated by taking the Enterprise Value (market cap + debt - cash) / NTM revenue.
Overall Stats:
Overall Median: 6.0x
Top 5 Median: 11.6x
10Y: 3.8%
Bucketed by Growth. In the buckets below I consider high growth >30% projected NTM growth, mid growth 15%-30% and low growth <15%
High Growth Median: 10.5x
Mid Growth Median: 6.2x
Low Growth Median: 3.9x
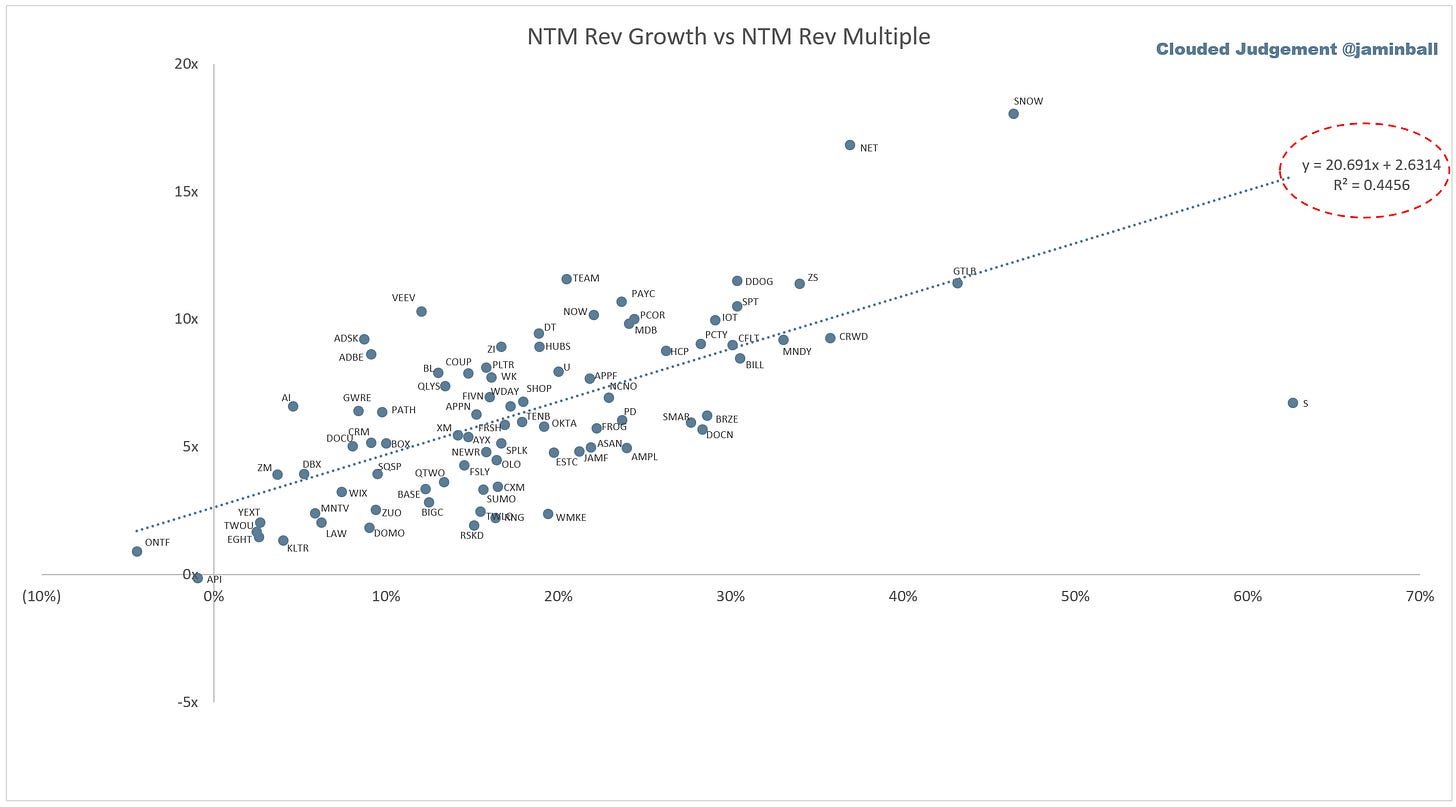
Scatter Plot of EV / NTM Rev Multiple vs NTM Rev Growth
How correlated is growth to valuation multiple?
Growth Adjusted EV / NTM Rev
The below chart shows the EV / NTM revenue multiple divided by NTM consensus growth expectations. The goal of this graph is to show how relatively cheap / expensive each stock is relative to their growth expectations
Operating Metrics
Median NTM growth rate: 16%
Median LTM growth rate: 28%
Median Gross Margin: 74%
Median Operating Margin (25%)
Median FCF Margin: 0%
Median Net Retention: 119%
Median CAC Payback: 32 months
Median S&M % Revenue: 47%
Median R&D % Revenue: 28%
Median G&A % Revenue: 20%
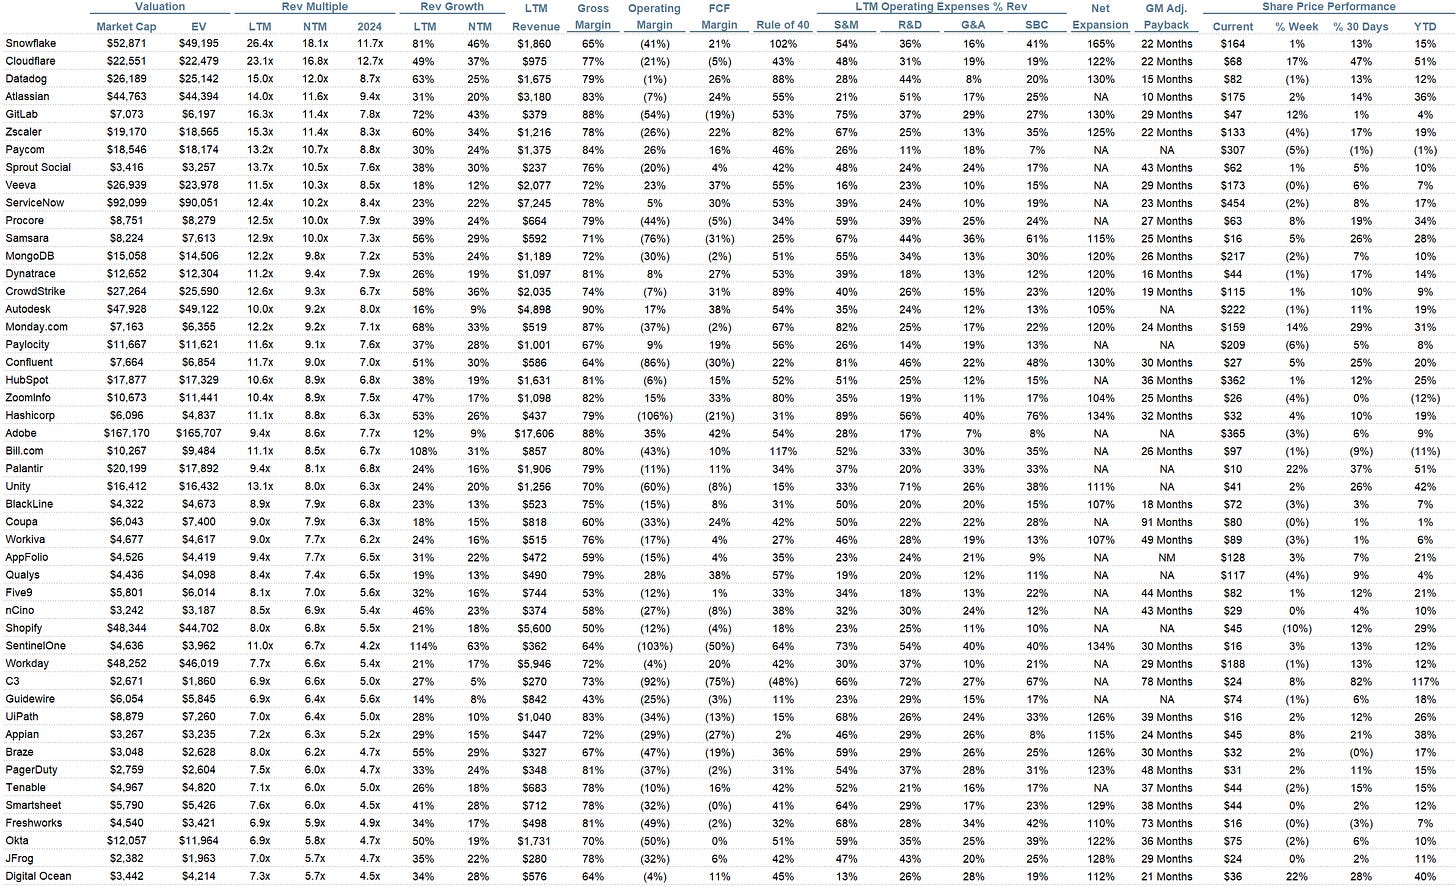
Comps Output
Rule of 40 shows LTM growth rate + LTM FCF Margin. FCF calculated as Cash Flow from Operations - Capital Expenditures
GM Adjusted Payback is calculated as: (Previous Q S&M) / (Net New ARR in Q x Gross Margin) x 12 . It shows the number of months it takes for a SaaS business to payback their fully burdened CAC on a gross profit basis. Most public companies don’t report net new ARR, so I’m taking an implied ARR metric (quarterly subscription revenue x 4). Net new ARR is simply the ARR of the current quarter, minus the ARR of the previous quarter. Companies that do not disclose subscription rev have been left out of the analysis and are listed as NA.
This post and the information presented are intended for informational purposes only. The views expressed herein are the author’s alone and do not constitute an offer to sell, or a recommendation to purchase, or a solicitation of an offer to buy, any security, nor a recommendation for any investment product or service. While certain information contained herein has been obtained from sources believed to be reliable, neither the author nor any of his employers or their affiliates have independently verified this information, and its accuracy and completeness cannot be guaranteed. Accordingly, no representation or warranty, express or implied, is made as to, and no reliance should be placed on, the fairness, accuracy, timeliness or completeness of this information. The author and all employers and their affiliated persons assume no liability for this information and no obligation to update the information or analysis contained herein in the future.


Anyone below the median CAC payback is in for a treat as cost of capital rises
Excellent find on the Larry Summers quote and Super Bowl analogy. 👍🏻