Every week I’ll provide updates on the latest trends in cloud software companies. Follow along to stay up to date!
Shades of 2021 in Venture Markets
Private markets are really starting to heat up, and I’m starting to see shades of 2021. Anything AI related has always been “hot,” but it has really hit a fever pitch in the last few months. What’s most interesting about this, is a lot of the darling AI companies from last year have really slowed down, but everyone seems to have forgotten this and is ready to “find the next big thing.”
When I stop and think about the similarities between today and 2021 a few things stand out:
Rounds with significant valuations (>100x ARR or around there) are being described as “we think it’s a call option.” I heard that a lot in 2021, and unfortunately not many call options hit… It’s hard to invest at 100x ARR and exit at 10x and make a return VCs aim for.
Everything getting pre-empted. The volume of pre-empted rounds is skyrocketing. This creates a lot of fomo in venture markets as no one wants their favorite prospect companies to get pre-empted, so they move first. And this cycle gets stronger and stronger
Larger secondaries. Self explanatory…but unfortunately starting to see more and more of this
“We just don’t want to lose relevance.” One way to be relevant is paying up for the consensus “hottest” deals. They get the attention in the press. And then that attention, in theory, leads to more founders wanting to talk to you. The flip side can be true - not participating in these deals leads to irrelevance. The amount of investors I talk to who seem to be motivated by “not loosing relevance” has picked up significantly recently, and this has created a lot of fomo investing. The reality is “paying up” and being super active in the venture markets make you an attractive option for founders looking to optimize on valuation…
Existing board members advising against term sheets offered. This is a more recent phenomenon. A few years after 2021 we started to see the downsides / hidden costs of raising at really high valuations. I wrote about this at length here. Many who lived through this see term sheets that are being offered to their current portfolio companies and are saying “I don’t think it’s the best thing for the company to raise this much money at this high of a valuation.” Many who said this in 2021 were right…And they’re starting to say it again in 2024
Unfortunately two competing statements can be true:
AI is a major platform / tech shift and will change the world
AI is in a bubble
There’s lots of fomo in the venture markets today. Funds have gotten quite large and haven’t deployed much in 2022 / 2023. There’s lots of dry powder, and many firms have moved to deployed dollars as the primary KPI over returned dollars…In 2021 it seemed like every company was able to raise a “2021 round.” Today it’s more of a tale of two worlds - either you’re dubbed an “AI winner” or “long term winner” and 2021 type rounds are thrown at you, or you’re not and it’s hard to raise any capital at all.
I do think it’s important for entrepreneurs and investors to remember the oh-so-distant past of 2021…While many of these rounds sound good today (less dilution, higher valuation in the press release, etc), these are short term motivators that often detract from the long term goal of building a sustainable business that creates value over a 10+ year arch. There is no one size fits all advice for raising venture funding. However, it’s important to be aware of the risks associated with the round you’re raising and proceed cautiously as we appear to be quickly heading back to a 2021 like environment.
Update on Q4 Earnings
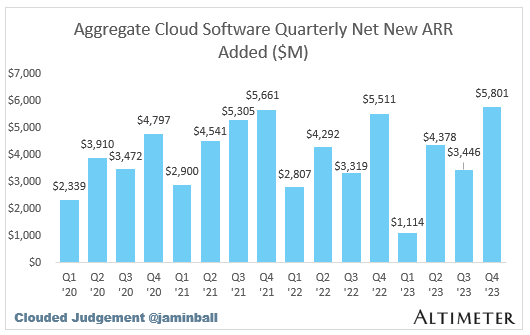
One metric I love tracking in net new ARR added in a quarter. The below chart shows the aggregate net new ARR added each quarter for the subset of companies who have reported Q4 so far (set of ~45 companies). It’s by no means an exhaustive list, but meant to be a representative set to show directionality in net new ARR performance. As you can see, Q4 is shaping up to be a record quarter for net new ARR added! This is consistent with a lot of the commentary on earnings calls of companies starting to see green shoots and macro headwinds easing
One other chart I like posting (and have for the last couple weeks) shows how full year 2024 guidance (or in some cases consensus estimates) compared to pre earnings consensus estimates. So far you can see the median is basically no change (ie companies guided full year right at where consensus estimates were)
Quarterly Reports Summary
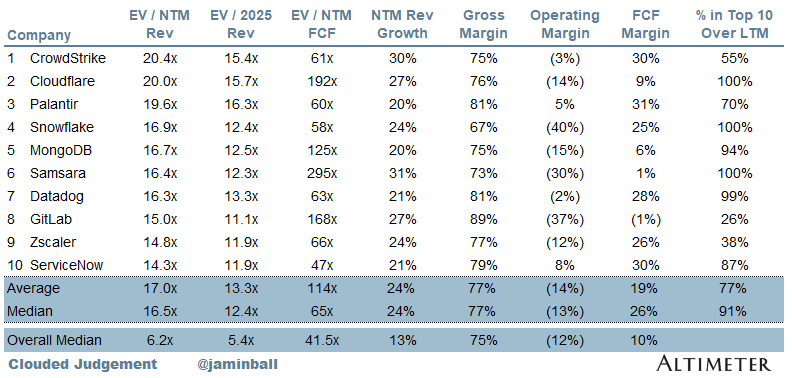
Top 10 EV / NTM Revenue Multiples
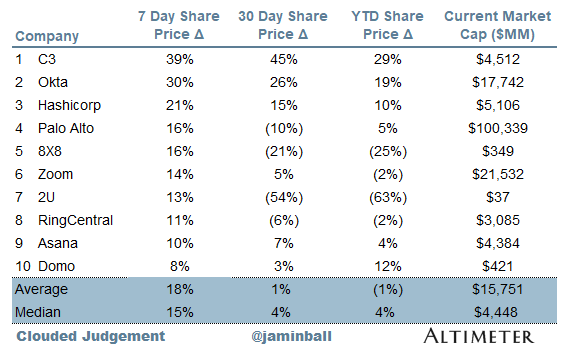
Top 10 Weekly Share Price Movement
Update on Multiples
SaaS businesses are generally valued on a multiple of their revenue - in most cases the projected revenue for the next 12 months. Revenue multiples are a shorthand valuation framework. Given most software companies are not profitable, or not generating meaningful FCF, it’s the only metric to compare the entire industry against. Even a DCF is riddled with long term assumptions. The promise of SaaS is that growth in the early years leads to profits in the mature years. Multiples shown below are calculated by taking the Enterprise Value (market cap + debt - cash) / NTM revenue.
Overall Stats:
Overall Median: 6.2x
Top 5 Median: 19.6x
10Y: 4.2%
Bucketed by Growth. In the buckets below I consider high growth >30% projected NTM growth, mid growth 15%-30% and low growth <15%
High Growth Median: 13.6x
Mid Growth Median: 10.1x
Low Growth Median: 4.3x
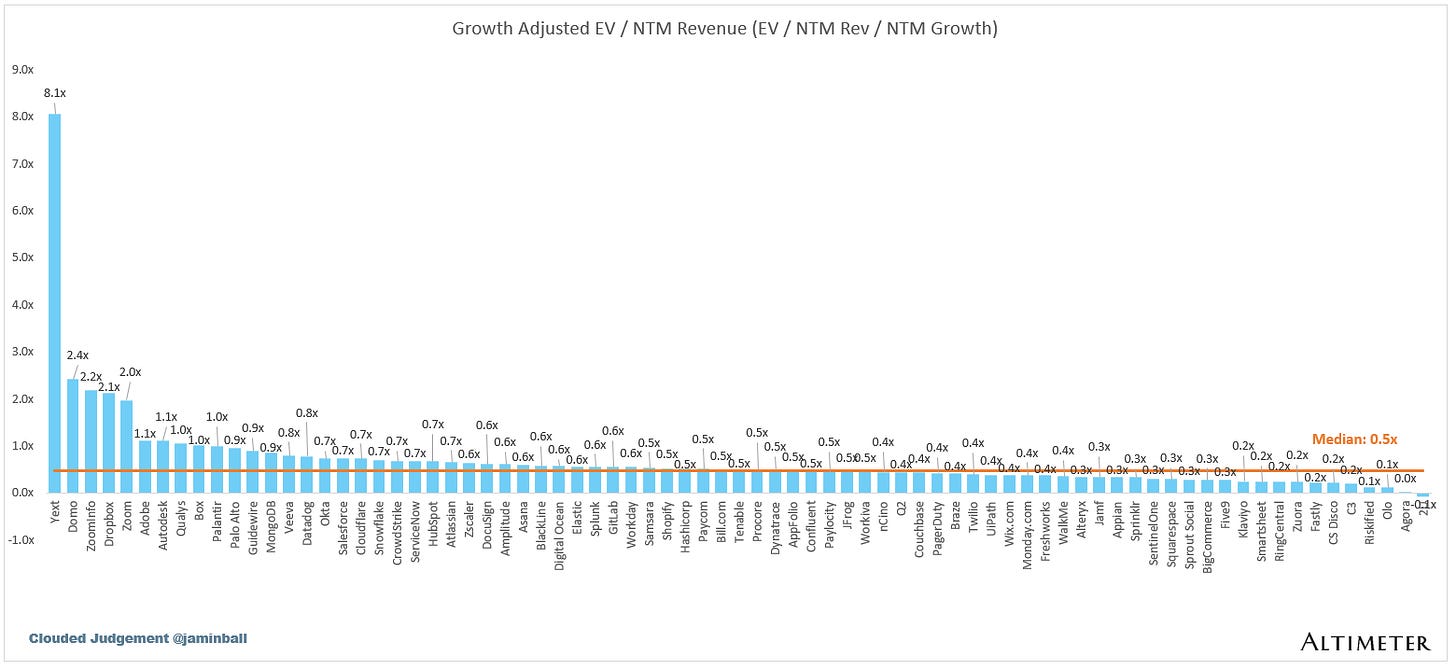
EV / NTM Rev / NTM Growth
The below chart shows the EV / NTM revenue multiple divided by NTM consensus growth expectations. So a company trading at 20x NTM revenue that is projected to grow 100% would be trading at 0.2x. The goal of this graph is to show how relatively cheap / expensive each stock is relative to their growth expectations
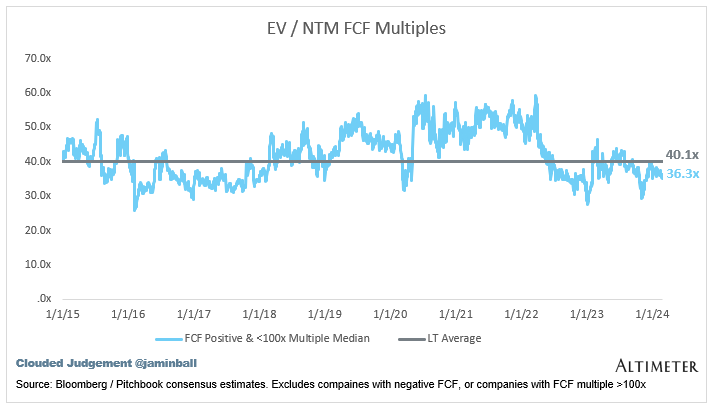
EV / NTM FCF
The line chart shows the median of all companies with a FCF multiple >0x and <100x. I created this subset to show companies where FCF is a relevant valuation metric.
Companies with negative NTM FCF are not listed on the chart
Scatter Plot of EV / NTM Rev Multiple vs NTM Rev Growth
How correlated is growth to valuation multiple?
Operating Metrics
Median NTM growth rate: 13%
Median LTM growth rate: 17%
Median Gross Margin: 75%
Median Operating Margin (12%)
Median FCF Margin: 10%
Median Net Retention: 110%
Median CAC Payback: 38 months
Median S&M % Revenue: 42%
Median R&D % Revenue: 25%
Median G&A % Revenue: 16%
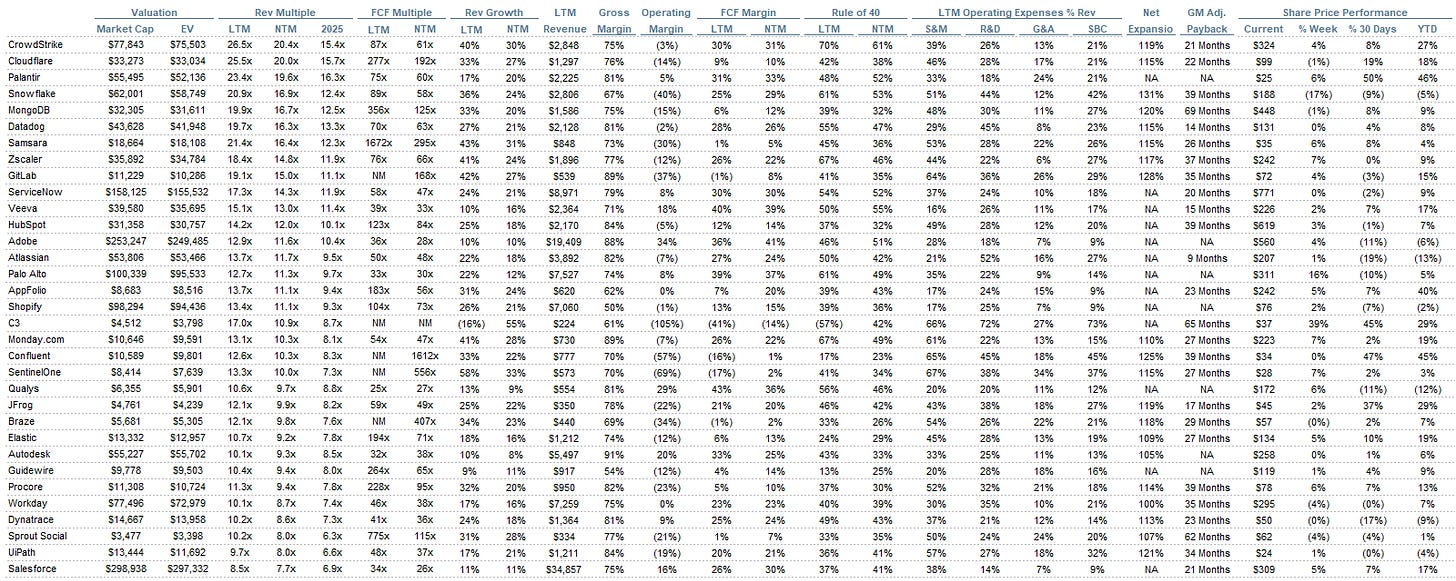
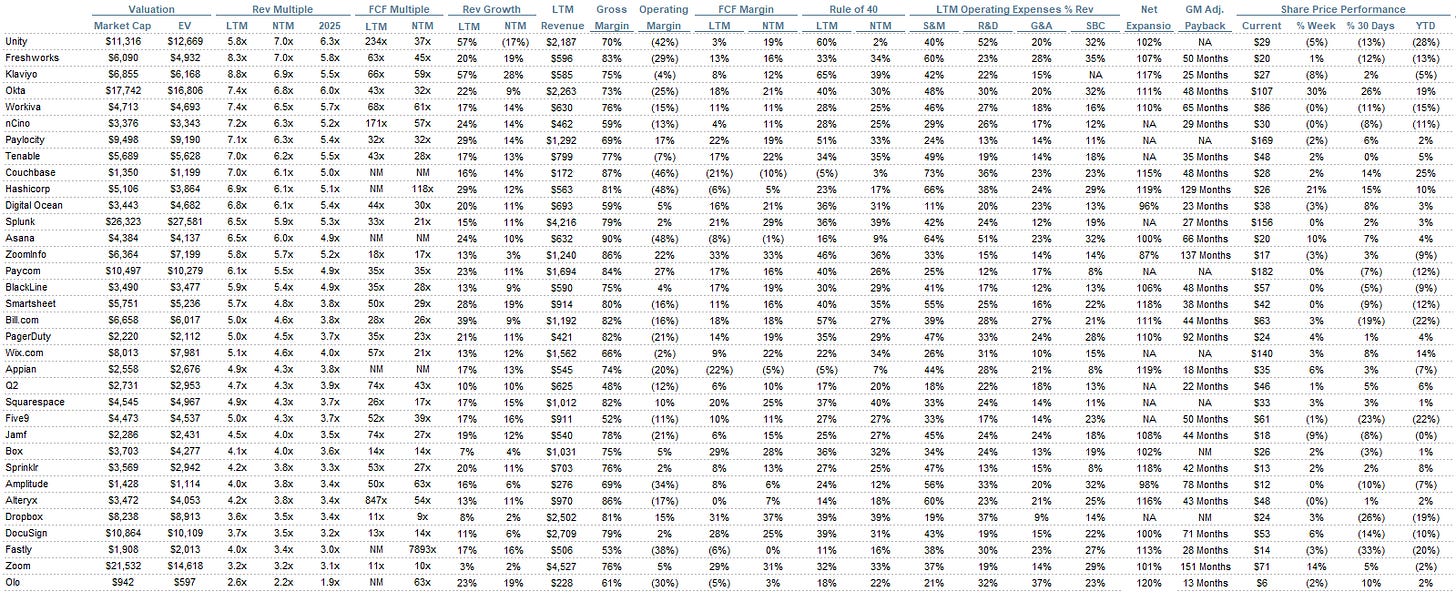
Comps Output
Rule of 40 shows rev growth + FCF margin (both LTM and NTM for growth + margins). FCF calculated as Cash Flow from Operations - Capital Expenditures
GM Adjusted Payback is calculated as: (Previous Q S&M) / (Net New ARR in Q x Gross Margin) x 12 . It shows the number of months it takes for a SaaS business to payback their fully burdened CAC on a gross profit basis. Most public companies don’t report net new ARR, so I’m taking an implied ARR metric (quarterly subscription revenue x 4). Net new ARR is simply the ARR of the current quarter, minus the ARR of the previous quarter. Companies that do not disclose subscription rev have been left out of the analysis and are listed as NA.
Sources used in this post include Bloomberg, Pitchbook and company filings
The information presented in this newsletter is the opinion of the author and does not necessarily reflect the view of any other person or entity, including Altimeter Capital Management, LP ("Altimeter"). The information provided is believed to be from reliable sources but no liability is accepted for any inaccuracies. This is for information purposes and should not be construed as an investment recommendation. Past performance is no guarantee of future performance. Altimeter is an investment adviser registered with the U.S. Securities and Exchange Commission. Registration does not imply a certain level of skill or training.
This post and the information presented are intended for informational purposes only. The views expressed herein are the author’s alone and do not constitute an offer to sell, or a recommendation to purchase, or a solicitation of an offer to buy, any security, nor a recommendation for any investment product or service. While certain information contained herein has been obtained from sources believed to be reliable, neither the author nor any of his employers or their affiliates have independently verified this information, and its accuracy and completeness cannot be guaranteed. Accordingly, no representation or warranty, express or implied, is made as to, and no reliance should be placed on, the fairness, accuracy, timeliness or completeness of this information. The author and all employers and their affiliated persons assume no liability for this information and no obligation to update the information or analysis contained herein in the future.









I'd be interested to know if you have been tracking marketing and sales spend as a percentage of revenue for Saas over the last few years aka the sales efficiency ratio. If so how has it trended and are there correlations with other metrics such as NRR, net new ARR and the valuation multiples you track.
Thanks for the update/insights. Much appreciated.