Clouded Judgement 7.22.22
Every week I’ll provide updates on the latest trends in cloud software companies. Follow along to stay up to date!
A Recession is Coming, Right?
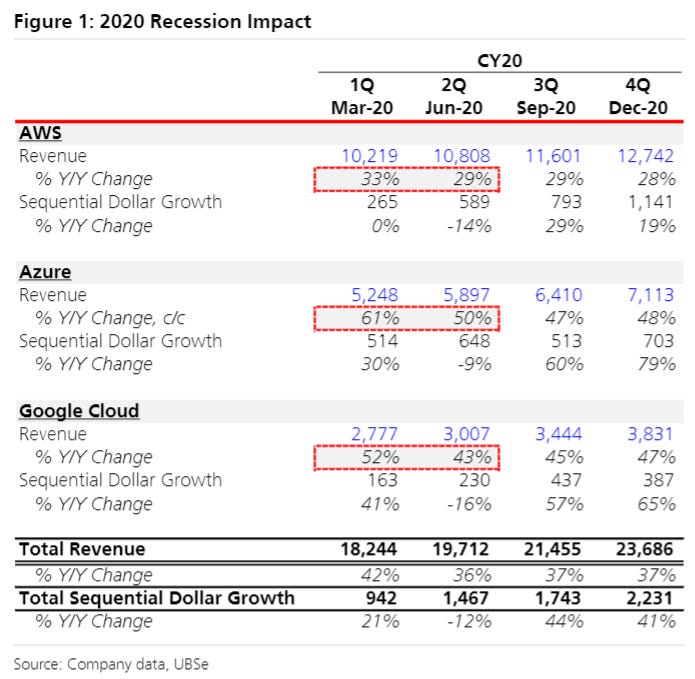
Last week I talked about earnings revisions and how I expect forward estimates (revenue) to be revised down for software in a recession / down market. I love the cloud and cloud software (and particularly cloud infra). The massive shift to the cloud is inevitable. However, in a recession it’s easy to put projects on pause that require people, process and spend. Yes, cloud is more efficient and reduces TCO and provides a whole host of other benefits. But there is an upfront cost associated with any of these transitions, and companies in a recession are thinking about limiting these costs. They’ll be put on pause, not canceled. Net net - I’m going to double down on my thinking that in the short term numbers will come down. UBS came out with a great note yesterday on cloud infra talking about AWS, Azure and GCP. The takeaway? “Bottom line, our checks down-ticked relative to 3 months ago, with references to slower new migration activity and longer sales cycles on new deals that we haven’t heard over the last 18 months.” Later on they stated: “The second – and still looming – risk is that the current economic downturn motivates enterprises to a) search for “infrastructure optimization” savings, basically finding “leaky faucets” to turn off and thereby trim cloud infrastructure spend and/or b) slow on-premise to cloud migration activity.” Said another way, we’re starting to see cracks in the demand environment. Given the way software is sold, this may not show up in revenue figures for a quarter or two (first new bookings slow, then top line rev slows). In my post last week I showed how Datadog growth slowed at the onset of Covid. UBS called out how AWS, Azure and GCP growth deteriorated faster at the onset of Covid as well (their chart below)
One important point. As I said earlier, these projects will be put on pause, not canceled. This most likely means that we’ll see a short term (more rapid) deceleration in revenue growth, followed by acceleration (as companies start spending again, and as vendors face easier YoY comps). We saw that with Datadog coming out of 2020.
This brings us to the key question: “Is a recession coming?” According to a BofA survey of fund managers, a recession is consensus (chart below)
However, we got a couple interesting data points from some of the largest banks on their earnings call. JP Morgan CEO Jamie Dimon said:
“Consumers are in good shape. They're spending 10% more than last year, almost 30%+ more than pre-COVID. We've never seen business credit be better ever like in our lifetimes. Combined debit & credit spend is +15% YoY. Notably, the avg consumer is spending 35% more YoY on gas & ~6% more on recurring bills & other non-discretionary categories. They have yet to observe a pullback in discretionary spending, including in the lower income segments, with travel & dining growing 34% YoY. With spending growing faster than incomes, median deposit balances are down across income segments for the first time since the pandemic started, though cash buffers still remain elevated.”
Citi CEO Jane Fraser said:
“While sentiment has shifted, little of the data I see tells me the U.S. is on the cusp of a recession. Consumer spending remains well above pre-Covid levels with household savings providing a cushion for future stress. And as any employer will tell you, the job market remains very tight.”
There are other quotes I could paste here, but it’s more of the same. Are the banks telling us a recession is not on the horizon? The average consumer remains quite “strong.” This could be for three reasons 1) they actually are strong. 2) Consumers are depleting savings, but this is a ticking time bomb until savings runs out. 3) Old habits die hard. Spending more on credit with cash / income they can’t support.
Hard to saw where we end up, but I still think a soft landing will be very tricky to get to. While the average consumer is strong now, I think it could be a different picture 6-9 months from now. AT&T significantly cut their FCF guide for this year and said: “Some customers are starting to put off paying their phone bills. The emerging economic strain on consumers is adding to pressure the company had already been facing from deep discounts on new phones.” And then Snap reported yesterday, with a pretty clear signal the market is tipping down (ad spend gets cut early in a recession). The banks are telling us the “consumer is strong,” but I think we’re seeing more and more cracks.
Net net - I still think a recession is coming, and in that scenario forward estimates will need to be revised. Magnitude is hard to predict, and some businesses will prove to be way more resilient than others, but all should be effected in some capacity. This would imply near term volatility in stock prices. Generally when numbers come down so do stock prices… Growth slows, plus multiple compresses because of lower growth. This is the double whammy of a weakening demand environment.
Quarterly Reports Summary
Qualtrics kicked off earnings season, more to come next week!
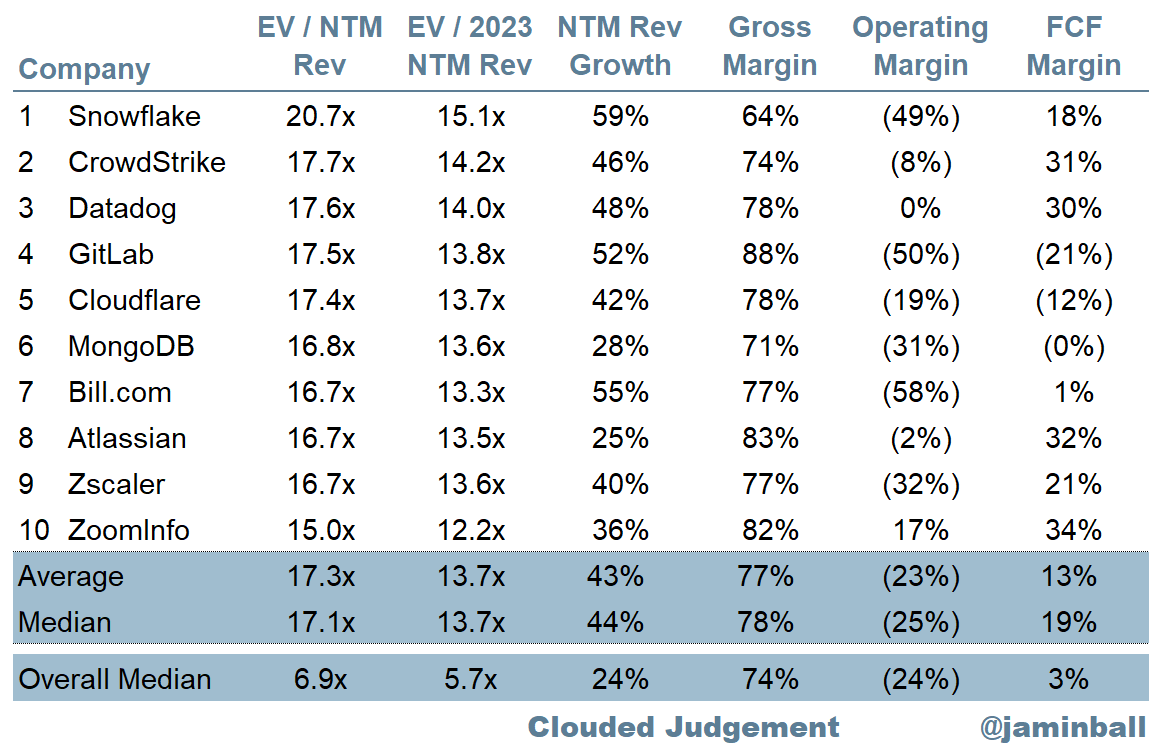
Top 10 EV / NTM Revenue Multiples
Top 10 Weekly Share Price Movement
Update on Multiples
SaaS businesses are valued on a multiple of their revenue - in most cases the projected revenue for the next 12 months. Multiples shown below are calculated by taking the Enterprise Value (market cap + debt - cash) / NTM revenue.
Overall Stats:
Overall Median: 6.9x
Top 5 Median: 17.6x
10Y: 2.9%
Bucketed by Growth. In the buckets below I consider high growth >30% projected NTM growth, mid growth 15%-30% and low growth <15%
High Growth Median: 9.2x
Mid Growth Median: 7.2x
Low Growth Median: 3.7x
Scatter Plot of EV / NTM Rev Multiple vs NTM Rev Growth
How correlated is growth to valuation multiple?
Growth Adjusted EV / NTM Rev
The below chart shows the EV / NTM revenue multiple divided by NTM consensus growth expectations. The goal of this graph is to show how relatively cheap / expensive each stock is relative to their growth expectations
Operating Metrics
Median NTM growth rate: 24%
Median LTM growth rate: 32%
Median Gross Margin: 74%
Median Operating Margin (24%)
Median FCF Margin: 3%
Median Net Retention: 120%
Median CAC Payback: 34 months
Median S&M % Revenue: 46%
Median R&D % Revenue: 27%
Median G&A % Revenue: 20%
Comps Output
Rule of 40 shows LTM growth rate + LTM FCF Margin. FCF calculated as Cash Flow from Operations - Capital Expenditures
GM Adjusted Payback is calculated as: (Previous Q S&M) / (Net New ARR in Q x Gross Margin) x 12 . It shows the number of months it takes for a SaaS business to payback their fully burdened CAC on a gross profit basis. Most public companies don’t report net new ARR, so I’m taking an implied ARR metric (quarterly subscription revenue x 4). Net new ARR is simply the ARR of the current quarter, minus the ARR of the previous quarter. Companies that do not disclose subscription rev have been left out of the analysis and are listed as NA.
This post and the information presented are intended for informational purposes only. The views expressed herein are the author’s alone and do not constitute an offer to sell, or a recommendation to purchase, or a solicitation of an offer to buy, any security, nor a recommendation for any investment product or service. While certain information contained herein has been obtained from sources believed to be reliable, neither the author nor any of his employers or their affiliates have independently verified this information, and its accuracy and completeness cannot be guaranteed. Accordingly, no representation or warranty, express or implied, is made as to, and no reliance should be placed on, the fairness, accuracy, timeliness or completeness of this information. The author and all employers and their affiliated persons assume no liability for this information and no obligation to update the information or analysis contained herein in the future.


Great piece as always.. can you please share UBS note (in full) you reference above.
Should the NTM multiples not be lower than the 2013 multiples assuming NTM revenues will be greater than 2023 revenues? I assume the NTM is from end June 2022 to end June 2023.