Every week I’ll provide updates on the latest trends in cloud software companies. Follow along to stay up to date!
Big Week of AI!
This week had a number of important AI announcements. Meta released Llama 3.1. OpenAI announced SearchGPT, their Google / Perplexity competitor. Mistral announced Mistral Large 2, their newest flagship model. The rate of innovation in the AI markets is staggering, and a reminder that it’s really hard for anyone (big companies especially) to “fully commit” to an AI strategy or vendor. They know they need something, but hard to make anything super concrete. The foundational tectonic plates are still shifting so rapidly that fully committing to anything would be premature. So instead, companies are looking to avoid locking, continue exploring, and keep an open mind on how the future will unfold. From the start of the foundation model wave OpenAI has maintained a distant lead over everyone else. Today, you could very credibly argue their model is in 3rd place behind Anthropic and Llama. Of course, this horse race of model providers will continue to jockey back and forth.
The Llama 3.1 announcement felt particularly important. Here are a couple things that really stood out to me.
Open source is now on par with state of the art proprietary models. This will have important implications on the business models / profit margins of key model players. OpenAI this week made fine tuning on GPT 4o Mini FREE. Absent the Llama 3.1 release, would this feature have been made free? If we rewind the clock back to the cloud buildout, the competition between the 3 main players has lead to numerous price changes. I asked ChatGPT how many price changes AWS has made to S3 since it’s inception in 2006, and the answer it gave me was 65. Staggering! Real competition in the open source will make AI more affordable for all
Synthetic data. Meta really highlighted their use of synthetic data used in the training of Llama 3.1. We know data is a bottleneck for future SOTA models, and synthetic data can be a big unlock. However, this created a lot of “questions” around what happens if models are recursively trained on their own synthetic outputs? The takeaway of that study seemed fairly obvious….but still worth pointing out. In practice, incremental data used is not just incremental synthetic data (based on the same set of historical data). Synthetic data can create one time (or shorter lived) improvements to model performance that over time start to degrade performance if all incremental data is syntheetic data. What happens in practice, is for newer models, new data is brought to the table. And synthetic data is generated from that new set of data. Said another way, we’ll always have a mixture of new data and new synthetic data to help solve the data bottleneck
Model Distillation. Model distillation is a technique where smaller, simpler models (called the student model) are trained to mimic the behavior of a larger, more complex model (called the teacher model, in this case Llama3.1). You use the outputs of larger model as inputs to train the smaller models. This makes the pre-training much simpler and cost effective! The primary goal of model distillation is to achieve comparable performance with the student model as the teacher model but with significantly reduced computational resources and model size. Historically, this has been explicitly forbidden in the model companies terms of service. This includes Llama 2 and 3! Neither permitted using Llama models to “train” smaller models. However, Meta changed this for 3.1! Here’s what they said “For Llama 2 and Llama 3, it's correct that the license restricts using any part of the Llama models, including the response outputs to train another AI model (LLM or otherwise). For Llama 3.1 however, this is allowed provided you as the developer provide the correct attribution. See the license for more information." This is really important, and potentially game changing for the development of smaller models! Similar to the GPT 4o Mini fine tuning that was made free, I expect other model companies will follow suit due to competitive pressures.
Big Tech Commentary on AI CapEx
A couple weeks ago I wrote about the Red Queen Effect - the idea that tech companies have no choice but to continue investing in AI in order to keep up competitively (due to the size of the prize). This week we got similar commentary from Google CEO Sundar Pichai and Meta CEO Mark Zuckerberg. Sundar said “the risk of under investing is dramatically greater than the risk of over-investing.” Zuckerberg said “I’d much rather over-invest and play for that outcome than save money by developing more slowly.” He also said “there’s a meaningful chance a lot of companies are over-building now and we’ll look back and they’ve spent some number of billions more than they had to, but they’re all making rational decisions because the downside of being behind leaves you out of position for the most important technology over the next 10-15 years”
It’s a fun time in the world of AI. More skepticism is a good thing!
Quarterly Reports Summary
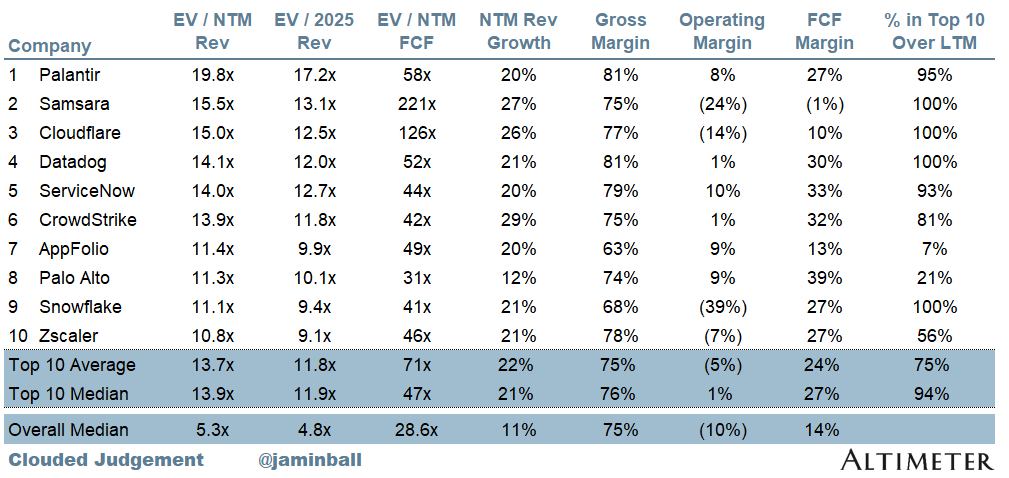
Top 10 EV / NTM Revenue Multiples
Top 10 Weekly Share Price Movement
Update on Multiples
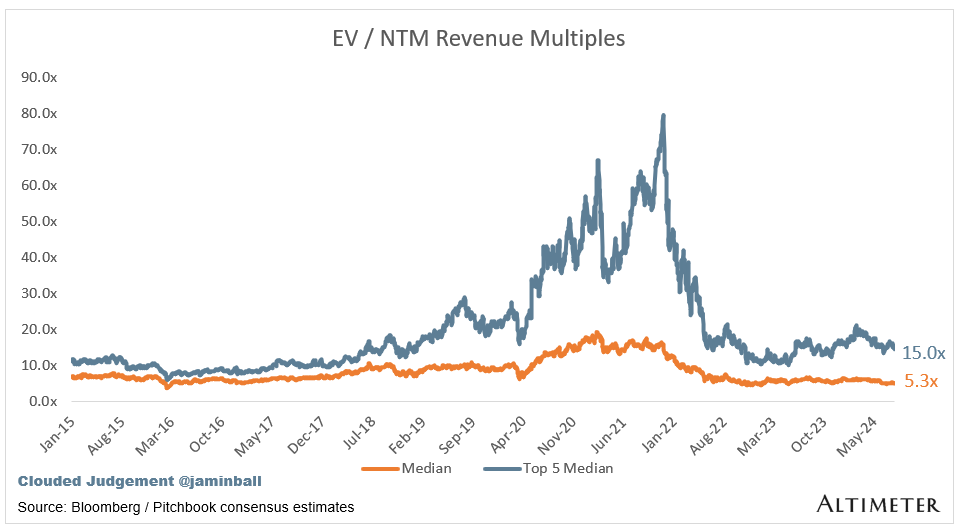
SaaS businesses are generally valued on a multiple of their revenue - in most cases the projected revenue for the next 12 months. Revenue multiples are a shorthand valuation framework. Given most software companies are not profitable, or not generating meaningful FCF, it’s the only metric to compare the entire industry against. Even a DCF is riddled with long term assumptions. The promise of SaaS is that growth in the early years leads to profits in the mature years. Multiples shown below are calculated by taking the Enterprise Value (market cap + debt - cash) / NTM revenue.
Overall Stats:
Overall Median: 5.3x
Top 5 Median: 15.0x
10Y: 4.2%
Bucketed by Growth. In the buckets below I consider high growth >27% projected NTM growth (I had to update this, as there’s only 1 company projected to grow >30% after this quarter’s earnings), mid growth 15%-27% and low growth <15%
High Growth Median: 10.3x
Mid Growth Median: 7.8x
Low Growth Median: 4.0x
EV / NTM Rev / NTM Growth
The below chart shows the EV / NTM revenue multiple divided by NTM consensus growth expectations. So a company trading at 20x NTM revenue that is projected to grow 100% would be trading at 0.2x. The goal of this graph is to show how relatively cheap / expensive each stock is relative to their growth expectations
EV / NTM FCF
The line chart shows the median of all companies with a FCF multiple >0x and <100x. I created this subset to show companies where FCF is a relevant valuation metric.
Companies with negative NTM FCF are not listed on the chart
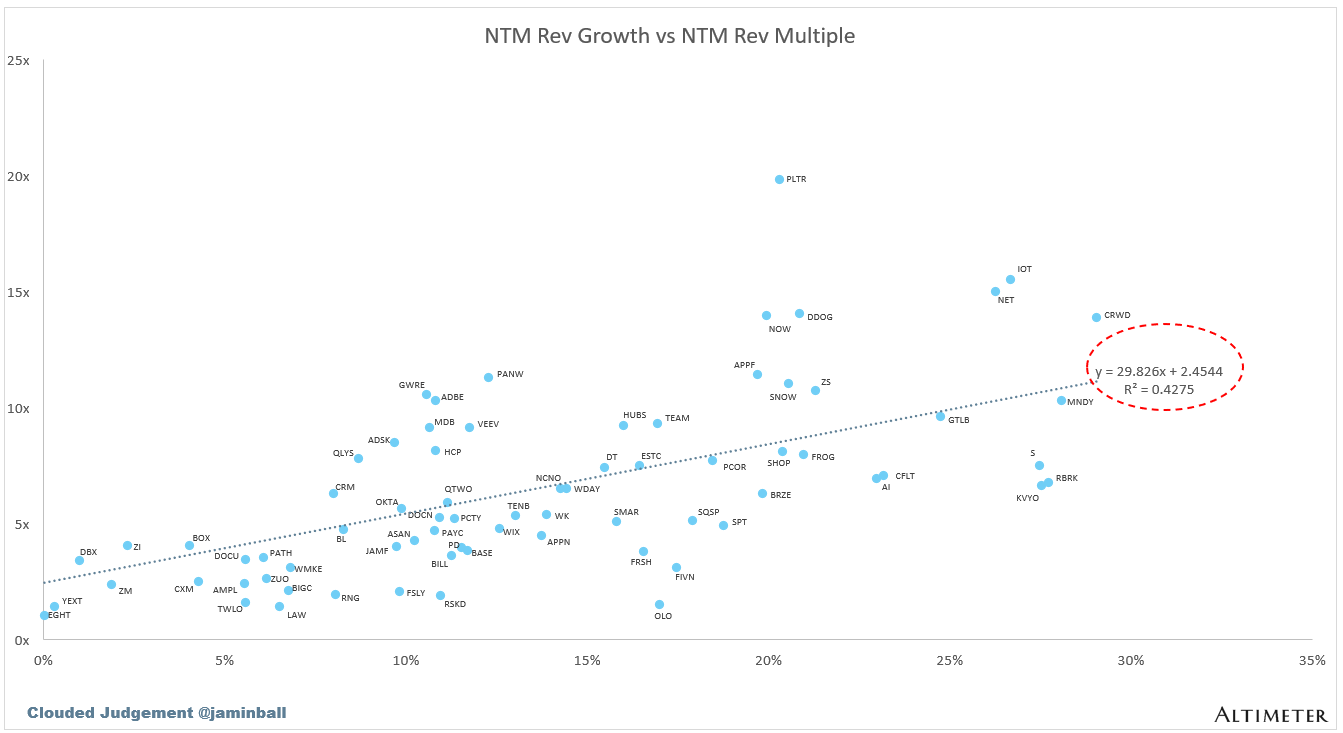
Scatter Plot of EV / NTM Rev Multiple vs NTM Rev Growth
How correlated is growth to valuation multiple?
Operating Metrics
Median NTM growth rate: 12%
Median LTM growth rate: 17%
Median Gross Margin: 75%
Median Operating Margin (10%)
Median FCF Margin: 14%
Median Net Retention: 110%
Median CAC Payback: 53 months
Median S&M % Revenue: 40%
Median R&D % Revenue: 25%
Median G&A % Revenue: 15%
Comps Output
Rule of 40 shows rev growth + FCF margin (both LTM and NTM for growth + margins). FCF calculated as Cash Flow from Operations - Capital Expenditures
GM Adjusted Payback is calculated as: (Previous Q S&M) / (Net New ARR in Q x Gross Margin) x 12 . It shows the number of months it takes for a SaaS business to payback their fully burdened CAC on a gross profit basis. Most public companies don’t report net new ARR, so I’m taking an implied ARR metric (quarterly subscription revenue x 4). Net new ARR is simply the ARR of the current quarter, minus the ARR of the previous quarter. Companies that do not disclose subscription rev have been left out of the analysis and are listed as NA.
Sources used in this post include Bloomberg, Pitchbook and company filings
The information presented in this newsletter is the opinion of the author and does not necessarily reflect the view of any other person or entity, including Altimeter Capital Management, LP ("Altimeter"). The information provided is believed to be from reliable sources but no liability is accepted for any inaccuracies. This is for information purposes and should not be construed as an investment recommendation. Past performance is no guarantee of future performance. Altimeter is an investment adviser registered with the U.S. Securities and Exchange Commission. Registration does not imply a certain level of skill or training.
This post and the information presented are intended for informational purposes only. The views expressed herein are the author’s alone and do not constitute an offer to sell, or a recommendation to purchase, or a solicitation of an offer to buy, any security, nor a recommendation for any investment product or service. While certain information contained herein has been obtained from sources believed to be reliable, neither the author nor any of his employers or their affiliates have independently verified this information, and its accuracy and completeness cannot be guaranteed. Accordingly, no representation or warranty, express or implied, is made as to, and no reliance should be placed on, the fairness, accuracy, timeliness or completeness of this information. The author and all employers and their affiliated persons assume no liability for this information and no obligation to update the information or analysis contained herein in the future.


