Freshworks: Benchmarking the S-1 Data
Recently Freshworks filed their initial S-1 statement. They will trade under the ticker FRSH. A S-1 is a document companies file with the SEC in preparation for listing their shares on an exchange like the NYSE or NASDAQ. The document contains a plethora of information on the company including a general overview, up to date financials, risk factors to the business, cap table highlights and much more. The purpose of the detailed information is to help investors (both institutional and retail) make informed investment decisions. There’s a lot of info to digest, so in the sections below I’ll try and pull out the relevant financial information and benchmark it against current cloud businesses. As far as an expected timeline - typically companies launch their roadshow ~3 weeks after filing their initial S-1 (the roadshow launches with an updated S-1 that contains a price range). After the roadshow launch there’s typically ~2 weeks before the stock starts trading. So we’re looking at roughly 5 weeks before any retail investor can buy the stock.
Freshworks Overview
From the S1 - “We provide businesses of all sizes with modern SaaS products that are designed with the user in mind. We started with Freshdesk, our customer experience (CX) product, and later expanded our offering to include Freshservice, our IT service management (ITSM) product. We then expanded our product offering to include a more complete customer relationship management (CRM) solution, which includes sales force and marketing automation. Finally, business users can have the power of modern SaaS technology with the ease of use of the most widely used consumer internet services.”
Product Overview
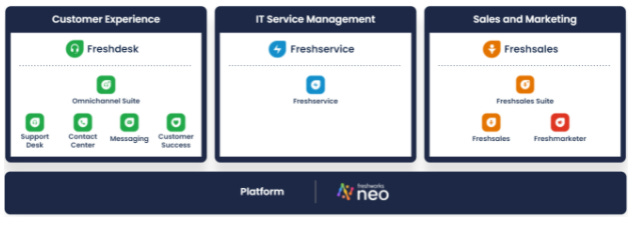
Freshworks offers 3 core product suits: Customer Experience, IT Service Management and Sales and Marketing
Customer Experience (CX): “The main product of our CX offerings is Freshdesk Support Desk, which businesses use to interact with their customers and respond to customer service requests.
Freshdesk Messaging. Freshdesk Messaging helps customer experience agents engage with customers across web, mobile, and social messaging applications. Our Freshdesk Messaging bot technology allows businesses to provide self service to customers by automating commonly performed transactions and providing answers to frequently asked questions.
FreshdeskContactCenter. Freshdesk Contact Center provides agents with a modern, cloud-based telephony system to connect with customers that supports complex call-flows, IVR, and routing needs.
Freshdesk Omnichannel Suite. Freshdesk Omnichannel Suite is an integrated suite that combines the capabilities of Freshdesk Support Desk, Freshdesk Messaging, and Freshdesk Contact Center, allowing agents to provide seamless customer experience across both digital and traditional channels.
Freshdesk Customer Success. Freshdesk Customer Success helps customer success managers at B2B subscription companies proactively manage their customers to increase customer retention and delight.
IT Service Management (ITSM): Freshservice enables IT teams to manage the delivery of IT services to the organization and delight their employees - all with an intuitive consumer-grade user experience employees now expect. Increasingly, departments across the business are using Freshservice for service management workflows outside of IT, enabling non-IT departments to leverage capabilities like service request catalogs, workflow automation and orchestration, and reporting to deliver services and improve employee satisfaction.
Sales and Marketing: The products for our Sales & Marketing offering are Freshsales, which businesses use for sales force automation, and Freshmarketer, which businesses use for marketing automation. We also offer Freshsales Suite that includes the best of sales force and marketing automation with a unified customer record so businesses can better market and sell to each customer.
Freshworks Neo: Freshworks Neo enables customers to extend and integrate Freshworks solutions to mold their business processes today, and adapt to business changes in the future. In addition, it provides a set of common, shared services to rapidly innovate and release new products. Key components of our Neo platform include a developer platform, enterprise services, foundational services, and the Freshworks Marketplace:
Market Opportunity
From the S-1: “We define our total addressable market in two ways…First, based on industry research from International Data Corporation (IDC), we believe we have a large addressable market of approximately $120 billion. As defined by IDC, we offer products that provide powerful functionality addressing select markets within CRM—including Customer Service, Contact Center, Salesforce Productivity and Management, and Marketing Campaign Management; and System and Service Management (SSM)—including IT Service Management, IT Operations Management and IT Automation and Configuration Management. According to IDC, by 2025, the markets we address within CRM will represent a $76 billion opportunity and the SSM market will represent a $44 billion opportunity.
Second, based on our internal data and analysis, we estimate the annual potential market opportunity for our products to be $77 billion. We calculate this estimate based on the total number of global companies using independent industry data from S&P Capital IQ and weighted average ARR of our products. We organize these companies into three cohorts based on how we organize our go-to-market efforts (SMB, Mid-Market, Enterprise). We then multiply the number of companies in each cohort by the weighted average ARR per customer for our largest product families of Freshdesk and Freshsales (CRM), and Freshservice (SSM) within each cohort, and sum the products for each cohort to arrive at our total market opportunity. We expect our estimated market opportunity will continue to expand as customers onboard more or expand usage of our products, increasing the weighted average ARR per customer for use of our products.”
How Freshworks Makes Money
From the S-1: “Since our inception, our go-to-market strategy has centered on offering exceptional products that are designed for the user. PLG is the core foundation of Freshworks and has helped us serve organizations of all sizes. The simplicity and powerful functionality underpinning our Freshworks solutions acts as the primary driver of customer acquisition, conversion, and expansion by driving trials of our products that we supplement with our inbound and outbound sales motions. Our go-to-market approach allows us to respond to how businesses want to buy our products. We offer our products under both free and paid subscription plans, further reducing friction to adoption and accelerating our go-to-market motion.”
Benchmark Data
The data shown below depicts how the Freshworks data compares to the operating metrics of current public SaaS businesses.
Last Twelve Months (LTM) Revenue
Freshworks generated $308M or revenue over the last twelve months
LTM Revenue Growth
Freshworks grew 49% over the last twelve months
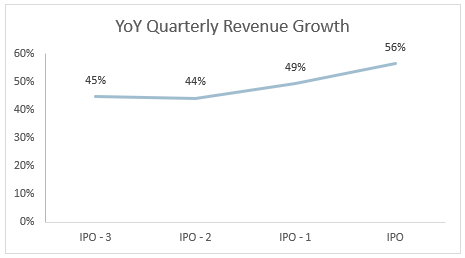
Quarterly YoY Revenue Growth Trends
Freshworks has accelerated nicely over the last couple quarters
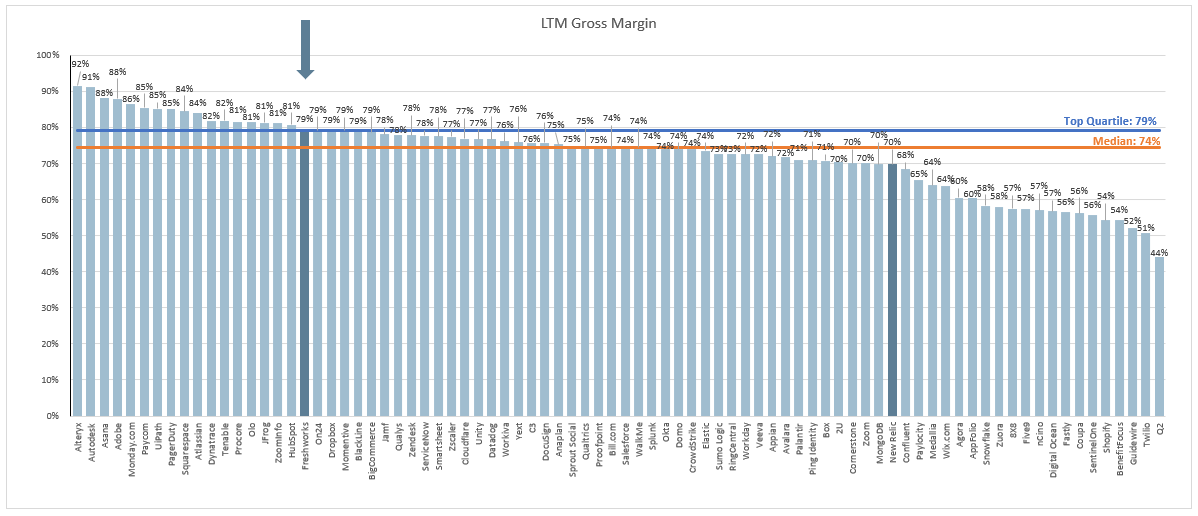
LTM GAAP Gross Margin
Freshworks LTM gross margin was 79%
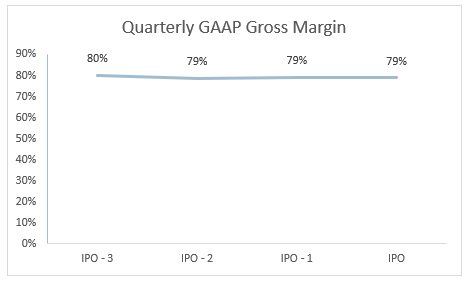
Gross margins have stayed relatively consistent over the last 4 quarters
LTM GAAP Operating Margin
GAAP operating margin has slightly decreased over the last 4 quarters
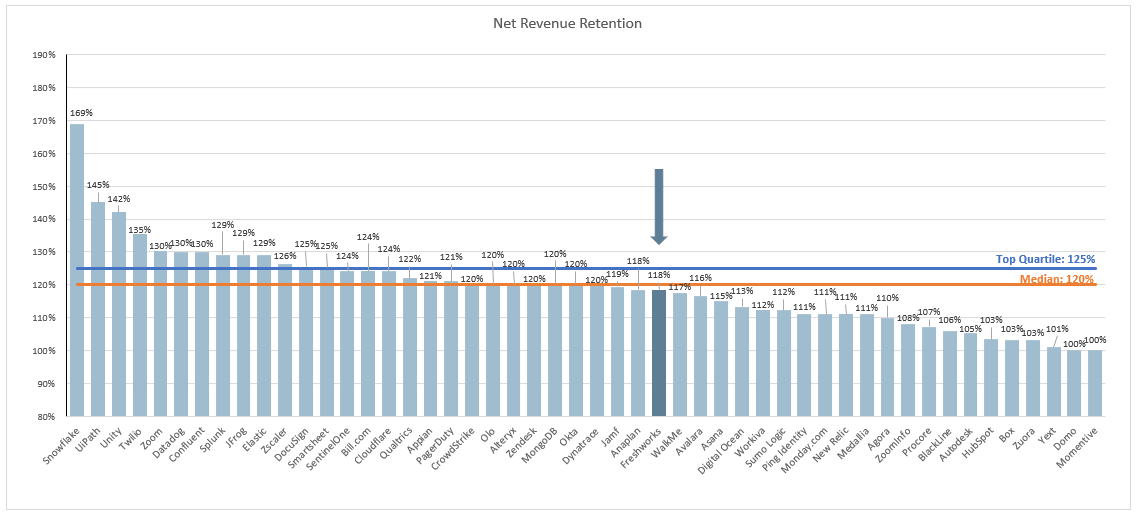
Net Dollar Retention Rate
This metric is calculated by taking the annual recurring revenue of a cohort of customers from 1 year ago, and comparing it to the current annual recurring revenue of that same set of customers (even if you experienced churn and that group of customers now only has 9, or anything <10).
Freshworks net dollar retention rate is 118%
Gross Margin Adjusted CAC Payback
(Previous Q S&M) / (Net New ARR x Gross Margin) x 12. This metric demonstrates how long it takes (in months) for a customer to pay back the cost at which it took to acquire them. In the chart below I’m taking the average of the 4 quarters leading up to IPO to normalize the business.
Freshworks CAC payback period is 24 months
LTM S&M Expense as % of LTM Revenue
Freshworks spent 53% of revenue on sales and marketing expenses over the last twelve months
Freshworks spent slightly more on S&M as a % of revenue over the last 4 quarters
Rule of 40
In the below chart I’m showing LTM revenue growth + LTM FCF margin.
This post and the information presented are intended for informational purposes only. The views expressed herein are the author’s alone and do not constitute an offer to sell, or a recommendation to purchase, or a solicitation of an offer to buy, any security, nor a recommendation for any investment product or service. While certain information contained herein has been obtained from sources believed to be reliable, neither the author nor any of his employers or their affiliates have independently verified this information, and its accuracy and completeness cannot be guaranteed. Accordingly, no representation or warranty, express or implied, is made as to, and no reliance should be placed on, the fairness, accuracy, timeliness or completeness of this information. The author and all employers and their affiliated persons assume no liability for this information and no obligation to update the information or analysis contained herein in the future.








Amazing work Jamin! For the CAC payback chart, you say "In the chart below I’m taking the average of the 4 quarters leading up to IPO to normalize the business." Are you taking the 4 quarters before each of these companies respective IPOs (different points in time), the 4 quarters before Freshworks IPO for all the companies, or only doing this for Freshworks?