Qualtrics: Benchmarking the S1 Data
Recently Qualtrics filed their initial S1 statement. Currently Qualtrics is a subsidiary of SAP (SAP acquired Qualtrics in 2019), and Qualtrics is spinning out as an independent public company. A S1 is a document companies file with the SEC in preparation for listing their shares on an exchange like the NYSE or NASDAQ. The document contains a plethora of information on the company including a general overview, up to date financials, risk factors to the business, cap table highlights and much more. The purpose of the detailed information is to help investors (both institutional and retail) make investment decisions. There’s a lot of info to digest, so in the sections below I’ll try and pull out the relevant financial information and benchmark it against current cloud businesses. As far as an expected timeline - typically companies launch their roadshow ~3 weeks after filing their initial S1 (the roadshow launches with an updated S1 with a price range). After the roadshow launch there’s typically ~2 weeks before the stock starts trading. So we’re looking at roughly 5 weeks before any retail investor can buy the stock.
Qualtrics Relationship with SAP - SAP will be a controlling stakeholder
Prior to the IPO, SAP owns 98.6% of Qualtrics.
“We were acquired by SAP on January 23, 2019, which we refer to as the SAP Acquisition, and prior to this offering and the investment by Q II, LLC, or Q II, an entity controlled by Ryan Smith, described below in “Recent Developments,” we operated as a wholly owned subsidiary of SAP. As a result, in the ordinary course of our business, we have received various services provided by SAP, including tax, accounting, treasury, legal, human resources, compliance, insurance, sales, and marketing services. SAP has also provided us with the services of a number of its executives and employees prior to this offering and will continue to do so after this offering.”
Qualtrics Overview
From the S1 - “We have pioneered a new category of software, experience management, or XM, which enables organizations to succeed in today’s experience economy. Our XM Platform helps organizations both design and improve the experiences that turn their customers into fanatics, employees into ambassadors, products into obsessions, and brands into religions… The Qualtrics XM Platform is a mission-critical software system that enables breakthrough design and continuous improvement of customer, employee, product, and brand experiences — the four core experiences of every organization. Qualtrics allows all four experiences to be managed on a single, connected platform:
CustomerXM –– decrease churn, increase engagement, and expand customer lifetime value, or LTV, by listening to customers across all channels and taking action on their feedback.
EmployeeXM –– drive retention, increase engagement, and improve productivity by continuously listening to employees and delivering better workplace experiences.
ProductXM –– design products people love, decrease time to market, and increase share of wallet by uncovering and acting on user needs, desires, and expectations.
BrandXM –– create a bedrock of loyal followers, acquire new customers, and increase market share by ensuring that your brand resonates at each critical touchpoint and attracts target buyers.”
Why Does Experience Management Matter?
“The rise of the experience economy has changed the way businesses compete and organizations operate. The cost of switching products or services has become so low that over 70% of consumers are likely to switch brands due to a single poor experience. Over two-thirds of the workforce is disengaged. And while the majority of companies believe they are delivering a superior experience, few of their customers agree. This is called the experience gap. Experience management is the business discipline of finding and fixing experience gaps.”
Market Opportunity (TAM)
“In today’s experience economy, we believe that experience management is more critical to improving customer experience than CRM, more influential upon employee experience than HCM systems, and more important to enhancing brand experience than Marketing Automation. As an emerging category of software, we believe that experience management has broad applicability to individuals at every level in an organization to gain valuable insight regarding the customer, employee, product, and brand experiences their organizations deliver and empower them to act decisively to address potential issues as they arise. Consequently, we believe that experience management represents a vast, rapidly growing, and underpenetrated market opportunity today, and we estimate our total addressable market, or TAM, to be approximately $60 billion in 2020.
We calculate our market opportunity by estimating the total number of organizations globally by referencing independent industry data. Organizations include global enterprises and governmental institutions with an estimated annual revenue greater than or equal to $50 million, United States K-12 academic institutions, and global post-secondary academic institutions. We then segment these organizations globally by type and size, and apply an average annual contract value to each segment using internally generated data of actual customer spend for the respective segment. For example, because larger enterprises have generally demonstrated greater deployment of our solutions across their organizations, we have segmented the number of enterprises into tiers to reflect this distinction. “
How Qualtrics Makes Money
“We generate revenue by selling subscriptions to our XM Platform and integrated solutions, as well as professional services. Over 99% of our contracts have a subscription period of one year or longer, and we primarily bill annually in advance. Subscription revenue comprised over 75% of our total revenue for the nine months ended September 30, 2020. We have a diversified customer base consisting of organizations of various sizes across virtually all industries. Our largest customer accounted for less than 2% of revenue in 2019, and our largest industries by annual recurring revenue, or ARR, as of September 30, 2020 were financial services, professional and business services, education, technology, government and healthcare. ARR is calculated by annualizing subscription revenue in the last month of a period. We price and package our software subscriptions solutions based on the capacity, use case and functionality needs of our customers…Our professional services consist primarily of research services, though our DesignXM offering, which allows customers to gain market intelligence by procuring a curated group of respondents and returning tangible results, while conforming to best-practice design and methodology, as well as implementations, configurations, integration and engineering services to help customers deploy our XM Platform.”
Benchmark Data
The data shown below depicts how the Qualtrics data compares to the operating metrics of current public SaaS businesses.
Last Twelve Months (LTM) Revenue
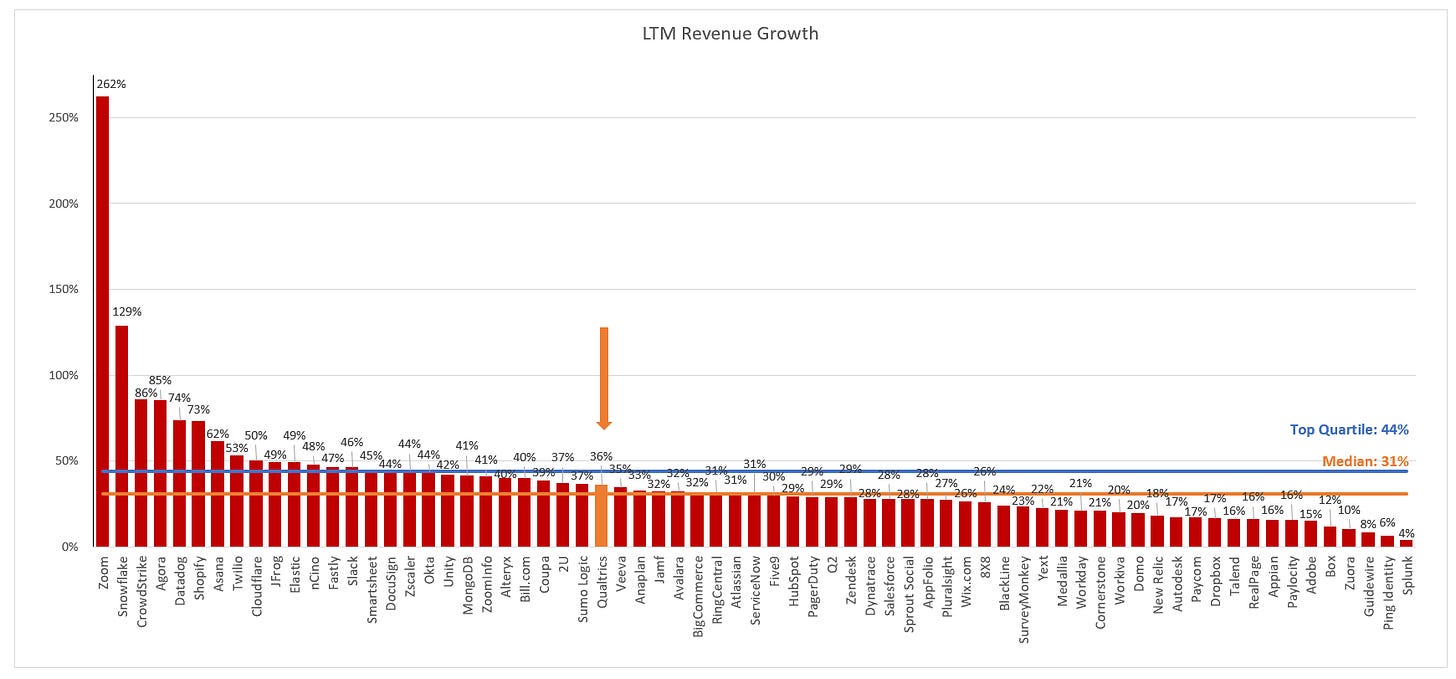
LTM Revenue Growth
Quarterly YoY Revenue Growth Trends
Qualtrics is at a much larger scale than most companies to go public. Because of this they aren’t seeing the hypergrowth that we’ve become accustomed to with recent IPOs
LTM GAAP Gross Margin
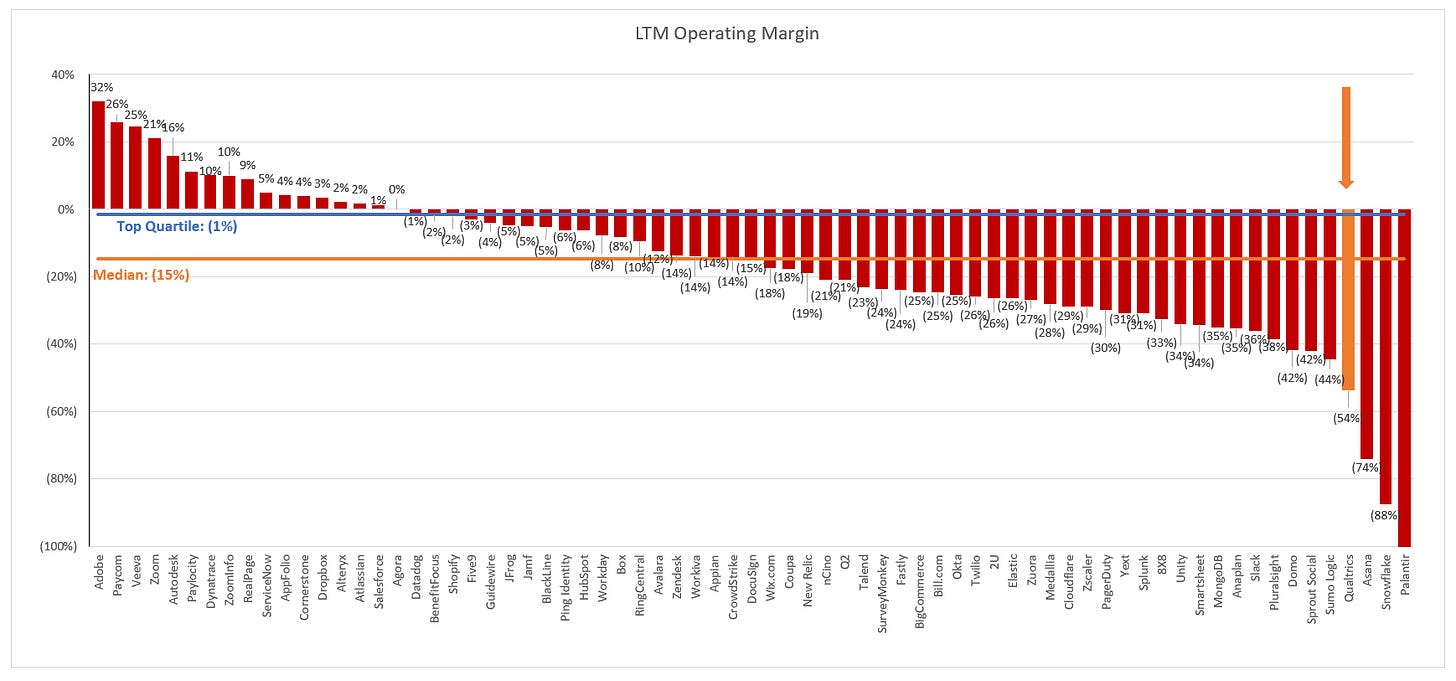
LTM GAAP Operating Margin
Rule of 40 (LTM Rev Growth + LTM FCF Margin)
To understand Qualtrics FCF we have to dig one level deeper (read the footnotes) than the numbers presented directly in the S1. Just looking at Qualtrics LTM FCF margin off the data you’d see a FCF margin of -67%. However, they incurred quite a few cash costs associated with their acquisition, and original proposed IPO (before SAP acquisition). There really aren’t operating costs. Factoring these out, we get to Qualtrics more accurate FCF margin of -14%. Still not great, but not nearly as bad as -67%.
Net Revenue Retention
This metric is calculated by taking the annual recurring revenue of a cohort of customers from 1 year ago, and comparing it to the current annual recurring revenue of that same set of customers (even if you experienced churn and that group of customers now only has 9, or anything <10). It’s one of my favorite SaaS metrics.
Gross Margin Adjusted CAC Payback
(Previous Q S&M) / (Net New ARR x Gross Margin) x 12. This metric demonstrates how long it takes (in months) for a customer to pay back the cost at which it took to acquire them. In the chart below I’m taking the average of the 4 quarters leading up to IPO to remove any seasonality out outliers.
LTM S&M % Rev
As you can see, Qualtrics spends more on sales and marketing costs than most of it’s SaaS peers
Valuation - My Prediction!
Predicting the valuation of pending IPOs is nearly impossible, but it adds to the fun to make predictions! In the SaaS / Cloud world companies are valued off a multiple of their revenue. Generally this is a projected revenue number, and for the purpose of this analysis I will be looking at NTM (next twelve months) projections. When I think about what a company will be worth I first like to look at how other public companies are valued. Currently high growth (growing >30% NTM) SaaS companies are trading at ~30x NTM rev, medium growth (growing between 15-30% NTM) SaaS companies are trading at ~18x NTM rev, and low growth (growing <15% NTM) companies are trading at ~7x NTM rev.
Qualtrics is much larger than most SaaS companies that go public, and therefore isn’t growing nearly as fast as some of the IPOs from this year. Looking at their quarterly YoY growth trends it’s fair to assume that their NTM growth will be <30%. I’m guessing somewhere in the ~25% range. While this is still impressive for their scale (~$723M LTM revenue), this is about the same scale as both Crowdstrike and Okta (who both have more premium multiples >30x NTM rev). Crowdstrike is growing at >80%, and Okta is growing at >40%. These are both quite a bit better than Qualtrics recent quarter of 27% YoY growth.
Just looking at Qualtrics financial profile, I think they should trade at a slight discount to the mid growth SaaS multiple of ~18x NTM rev. 25% NTM growth would put them in the high end of the mid growth bucket. However, their profitability, FCF and CAC payback are all below average. Generally I think that would ding them a bit more, but Qualtrics is a well understood company that I think will have a bit of buzz. Putting this all together, and assuming NTM growth is in the 20-25% range, I’m predicting they will be valued at ~$14B - $15B when they start trading.


Regarding net revenue retention, if a company had an NRR of 130%, but gross revenue retention of 40% for example. Would you consider that a significant red flag? (Obviously, would have to determine what's behind such a number, but generally speaking, would be interesting to hear how much attention you turn towards the NRR/GRR dynamic)
Extremely useful data and comparisons. Thanks very much for the work you are doing.