


Clouded Judgement 7.25.25 - TAMs Lie

Every week I’ll provide updates on the latest trends in cloud software companies. Follow along to stay up to date!
TAMs Lie
One of the easiest traps I fall into as an investor (which is even harder during platform shifts) is trying to evaluate a startup through the lens of the existing market. But early in big transitions, TAM analysis often leads to the wrong conclusions.
We saw it during the rise of the cloud. "The observability market is small." "Source control is commoditized." "Who needs another database?" These were reasonable takes if you assumed static markets and static buyer behavior. But they turned out to be wrong. What actually happened was this:
Cloud created new pain points and new markets (more data, more sprawl, more teams), which made old categories more valuable.
Cloud expanded access to tools that used to be too expensive or too complex for most teams.
Cloud shifted services to software. Things that used to require consultants became self-serve tools.
If I had to “add” all of these up, the “sum” would be “markets were created and expanded meaningfully and grew faster.”
And when that happens, TAMs don’t just grow they get reinvented (or invented).
We’re now seeing the exact same dynamic play out in AI.
Take AI code editors like Cursor or Claude Code. The “old” default TAM logic goes like this:
# developers × $20/month = market size. (because Copilot started charging $20 / month / dev)
Call it ~$7B globally (~30m developers x $20 x 12 months). Not bad,but not world-changing.
But that logic completely misses what’s actually happening. AI tools like these aren’t just “IDEs with autocomplete.” They’re reducing the time engineers spend reviewing, refactoring, writing tests, and documenting code. If the average developer costs $150K/year, and an AI assistant makes them 20% more productive, that’s $30K in value per seat. Not $240. And when we talk to folks using these tools, they say things like “if they raised prices 10x we’d still use them”
Even more interesting: these tools aren’t just for developers.
I’ve heard of sales, finance, and marketing folks using Claude Code or Cursor to write internal scripts, automate spreadsheet logic, or build simple workflows, tasks they’d normally hand off to engineering. These users weren’t even in the old TAM. That’s pure expansion.
And many of these new products don’t start as “pure AI” either. They often begin as human-in-the-loop services with a thin AI wrapper. A contract review tool that quietly has lawyers behind the scenes. A customer support bot that escalates to a human more than you'd expect. But that’s a feature, not a bug! It’s just the initial wedge. You start with a human to build trust, gather data, and prove value. Then over time, the AI takes over (as it gets smarter and gains more trust). What looked like a service at first becomes software at scale.
The platform shift doesn’t just make developers (or lawyers, or BDRs) faster. It creates new users. And when you do that, TAMs explode, because the value prop expands from “save time” to “unlock capability.”
TAM is a lagging indicator, that’s the takeaway I have from my last 10 years in venture. The best founders create new behavior, unlock new users, and pull spend from unexpected places. When platforms shift (cloud, mobile, and now AI) the most interesting companies aren’t bounded by the current markets, they redefine their own!
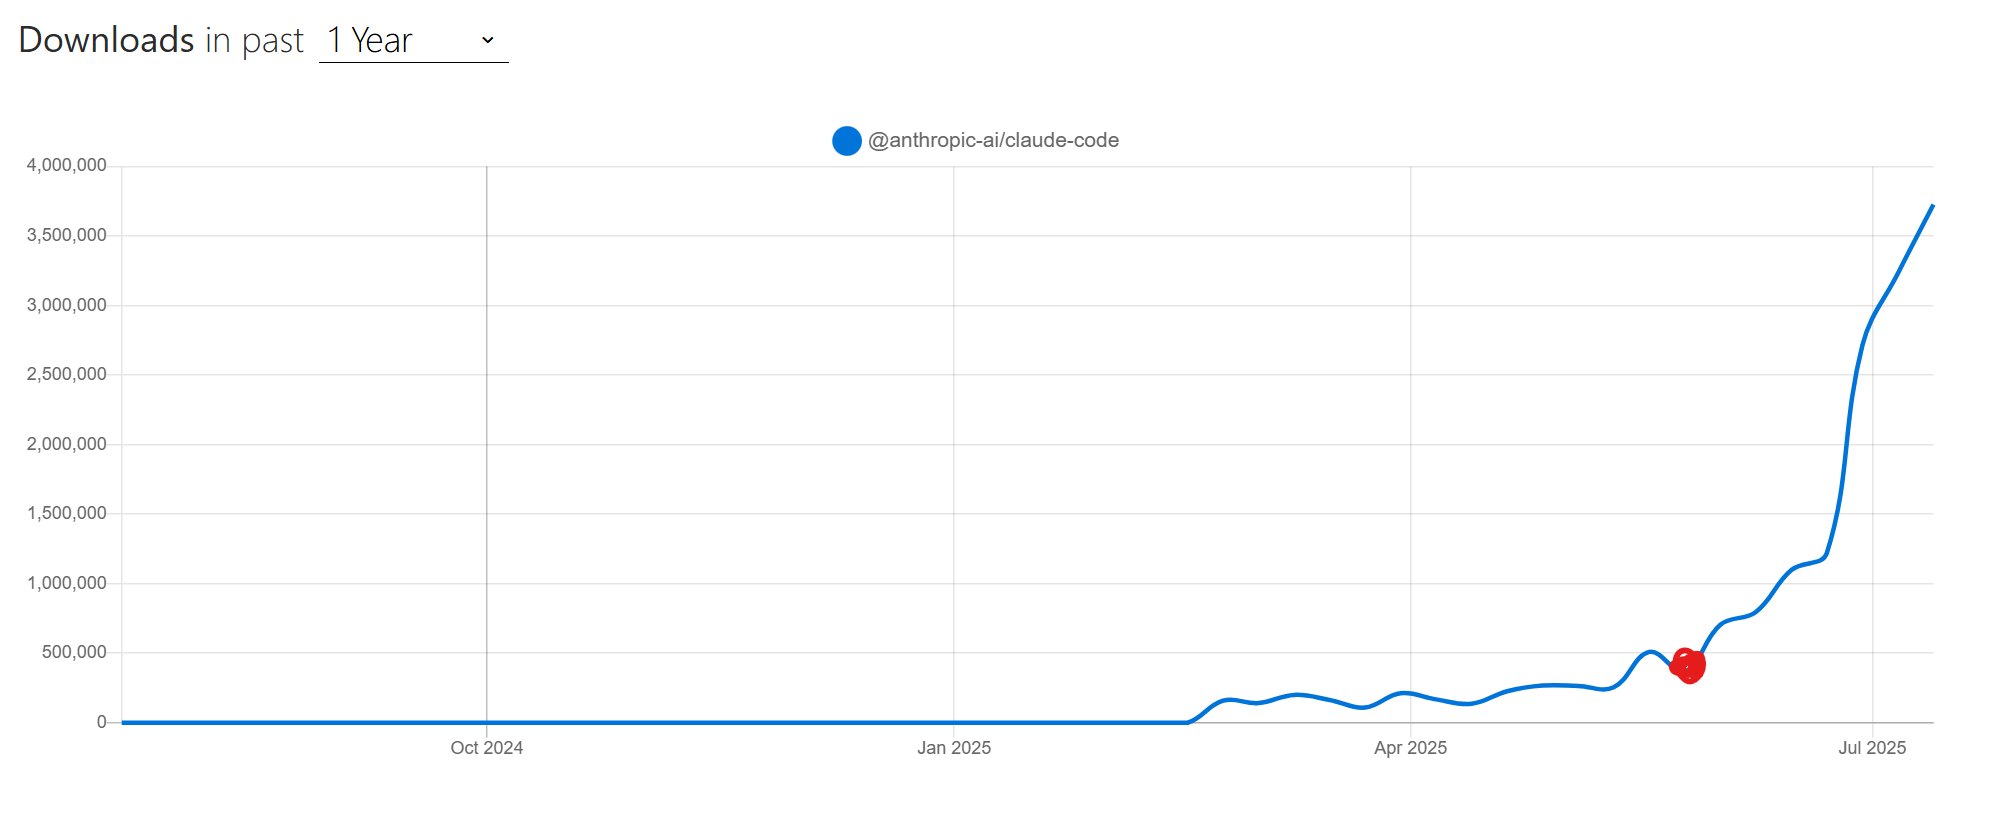
Couple other things I thought about while writing this post. A few weeks ago I wrote about the importance of speed. How you have to move fast, iterate fast, because markets are forming in real time and you want to be the one defining them vs following. Got me thinking about Claude Code and how it’s EXPLODED onto the scene in the last 2 months. Check out the npm downloads over the last year! The red dot is when it went GA end of May. Sometimes you don’t have to be first! Will be interesting to see how the market shakes out with Cursor and Claude Code over the next year.
The other thought I had relates to the post I wrote last week about the return of the point solution. The other reason TAMs lie is because often times a companies initial product is just the wedge to the ultimate opportunity. And that company gets SO GOOD at that initial wedge it earns them the right to layer more around it. SO many TAM analysis (in hindsight) are wrong because they only look at the size of the initial wedge vs seeing the bigger picture.
Quarterly Reports Summary

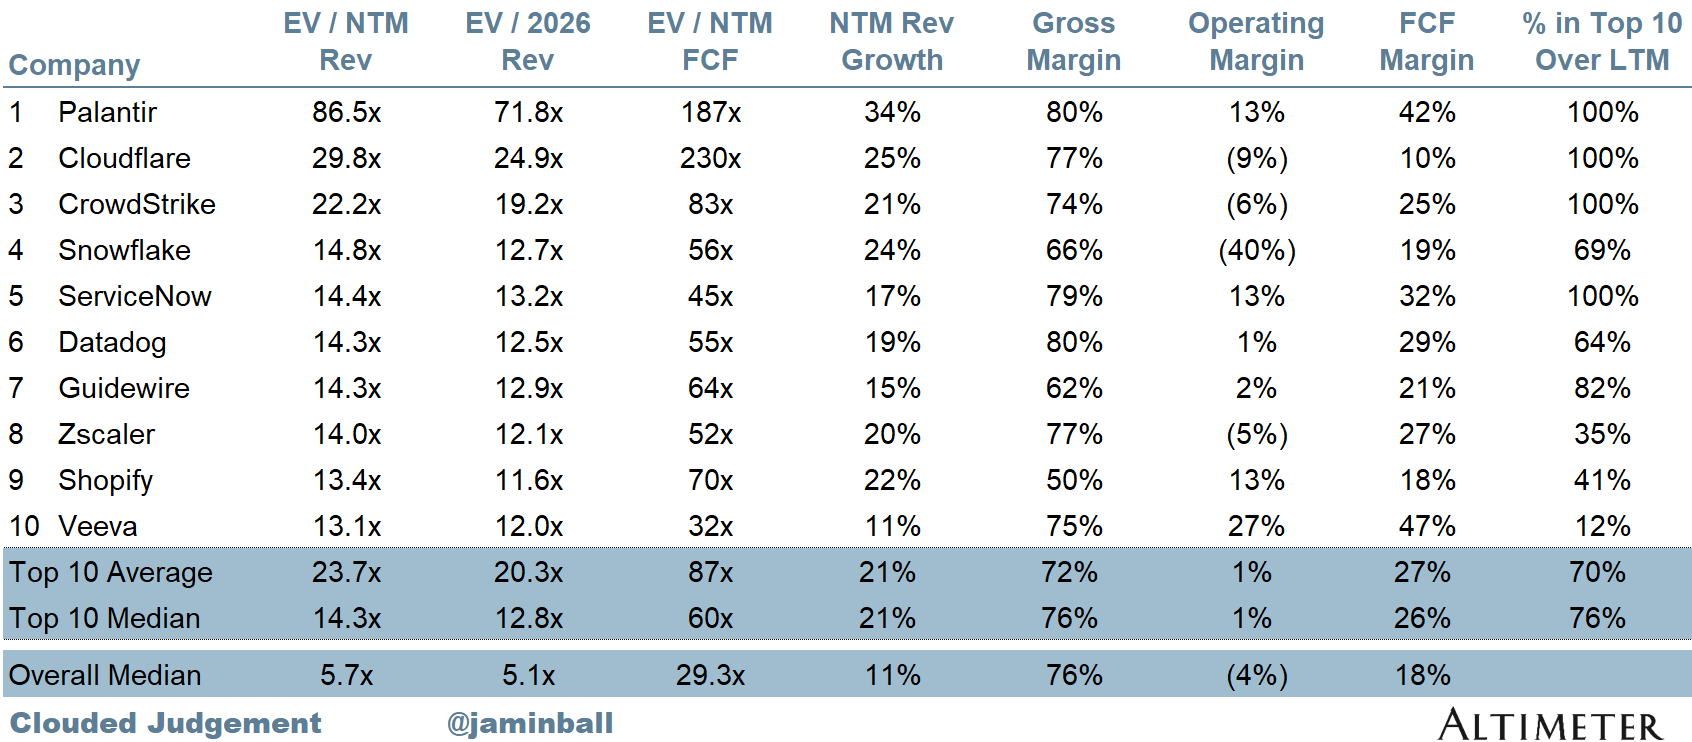
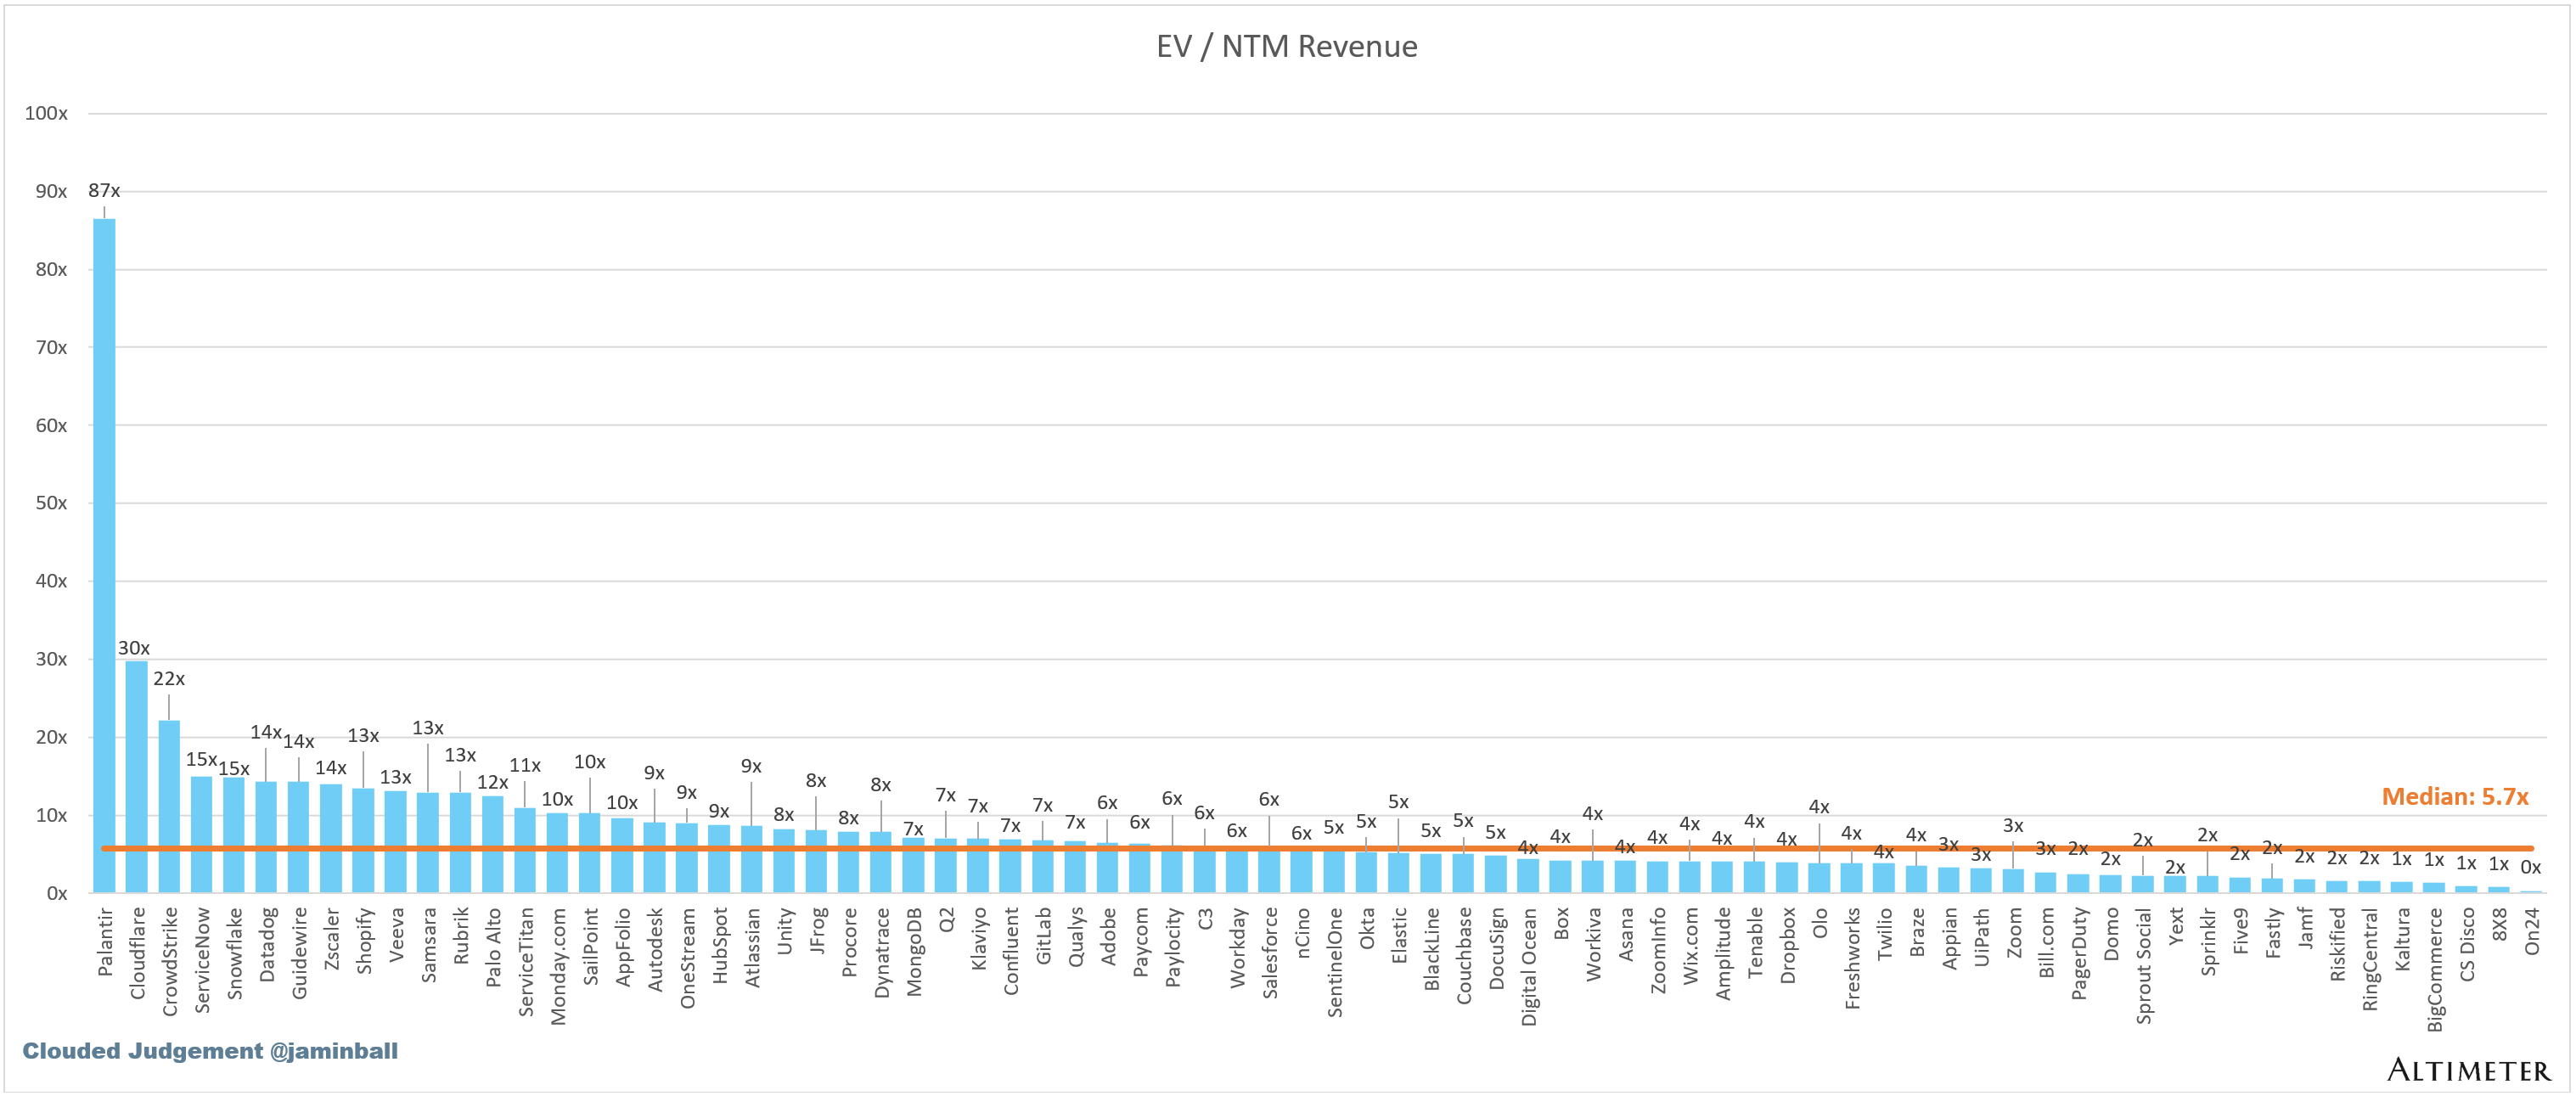
Top 10 EV / NTM Revenue Multiples
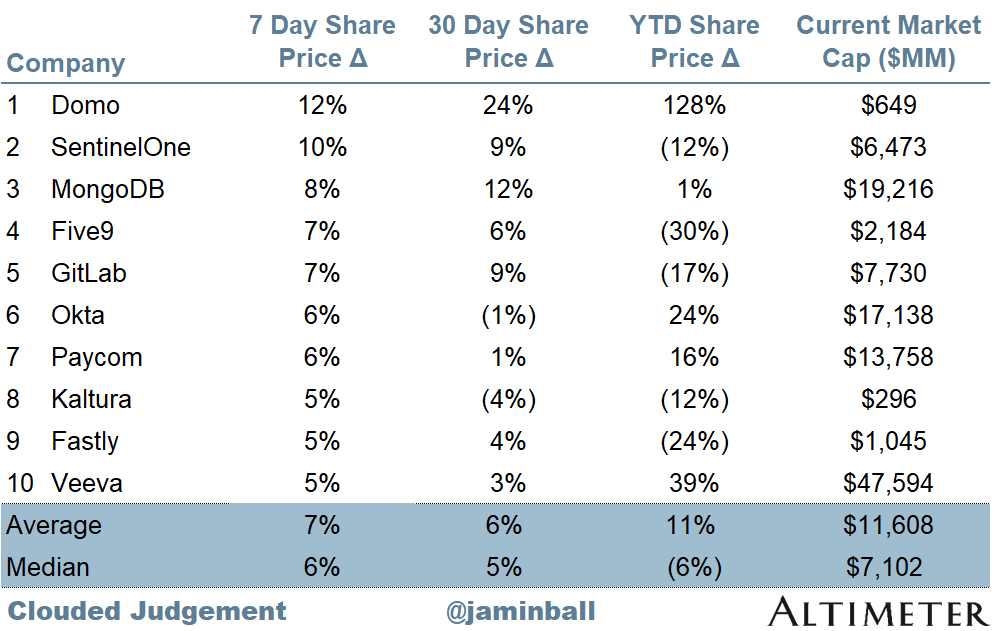
Top 10 Weekly Share Price Movement
Update on Multiples
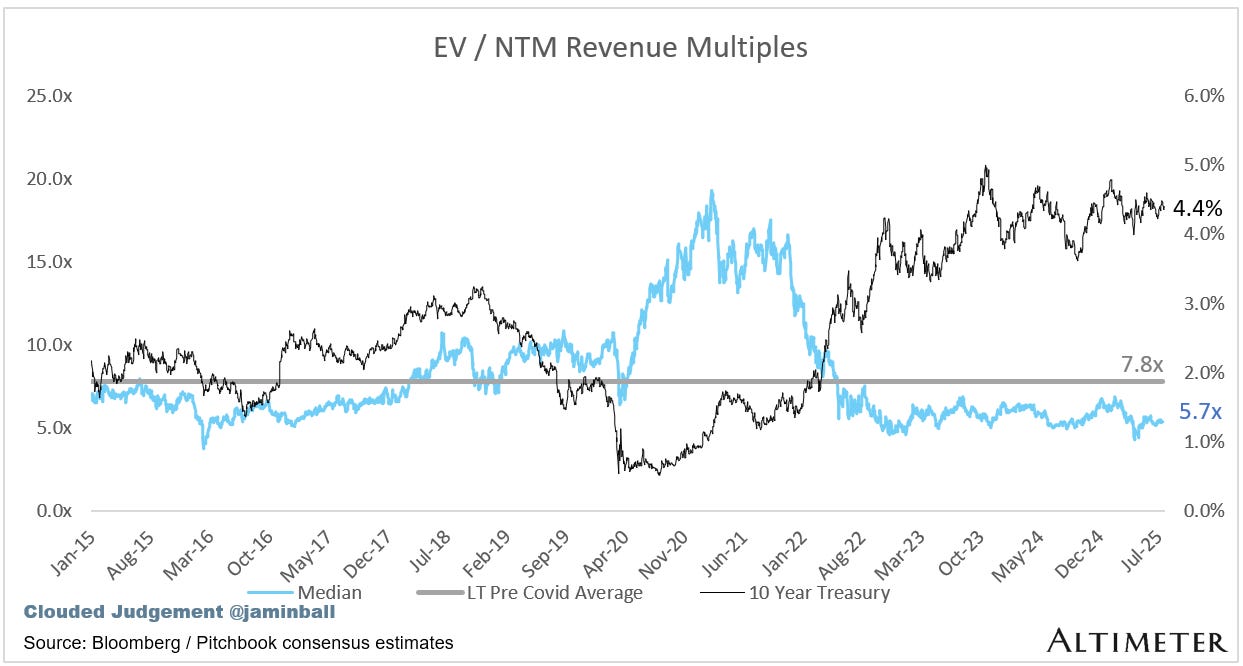
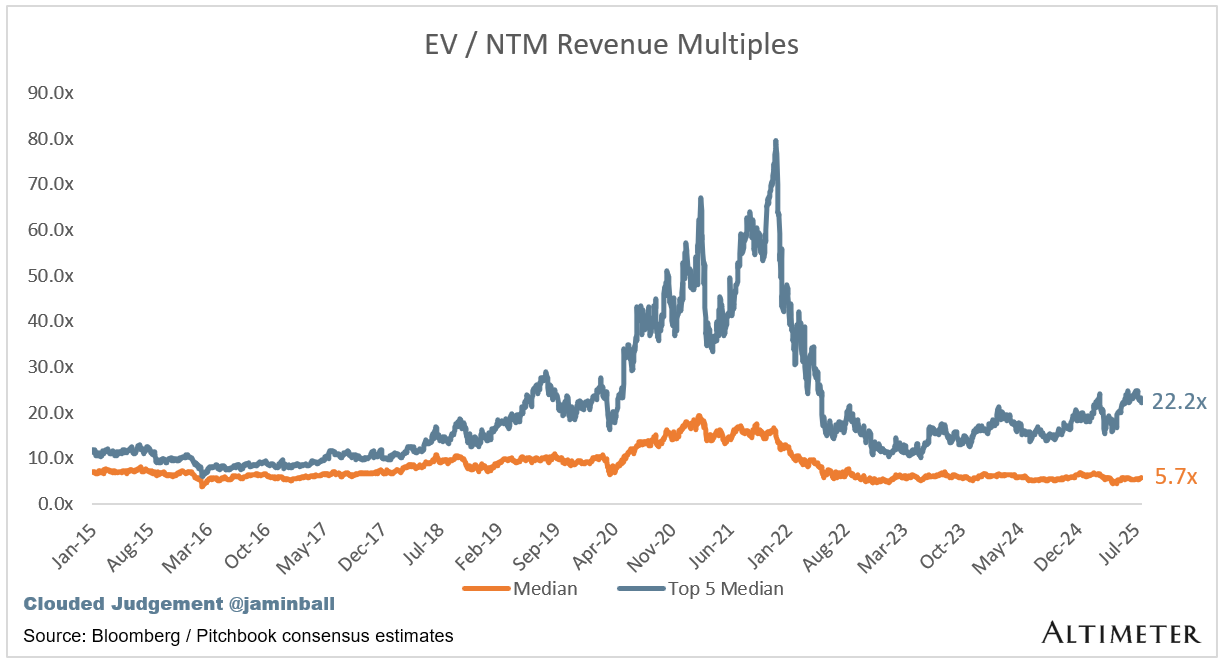
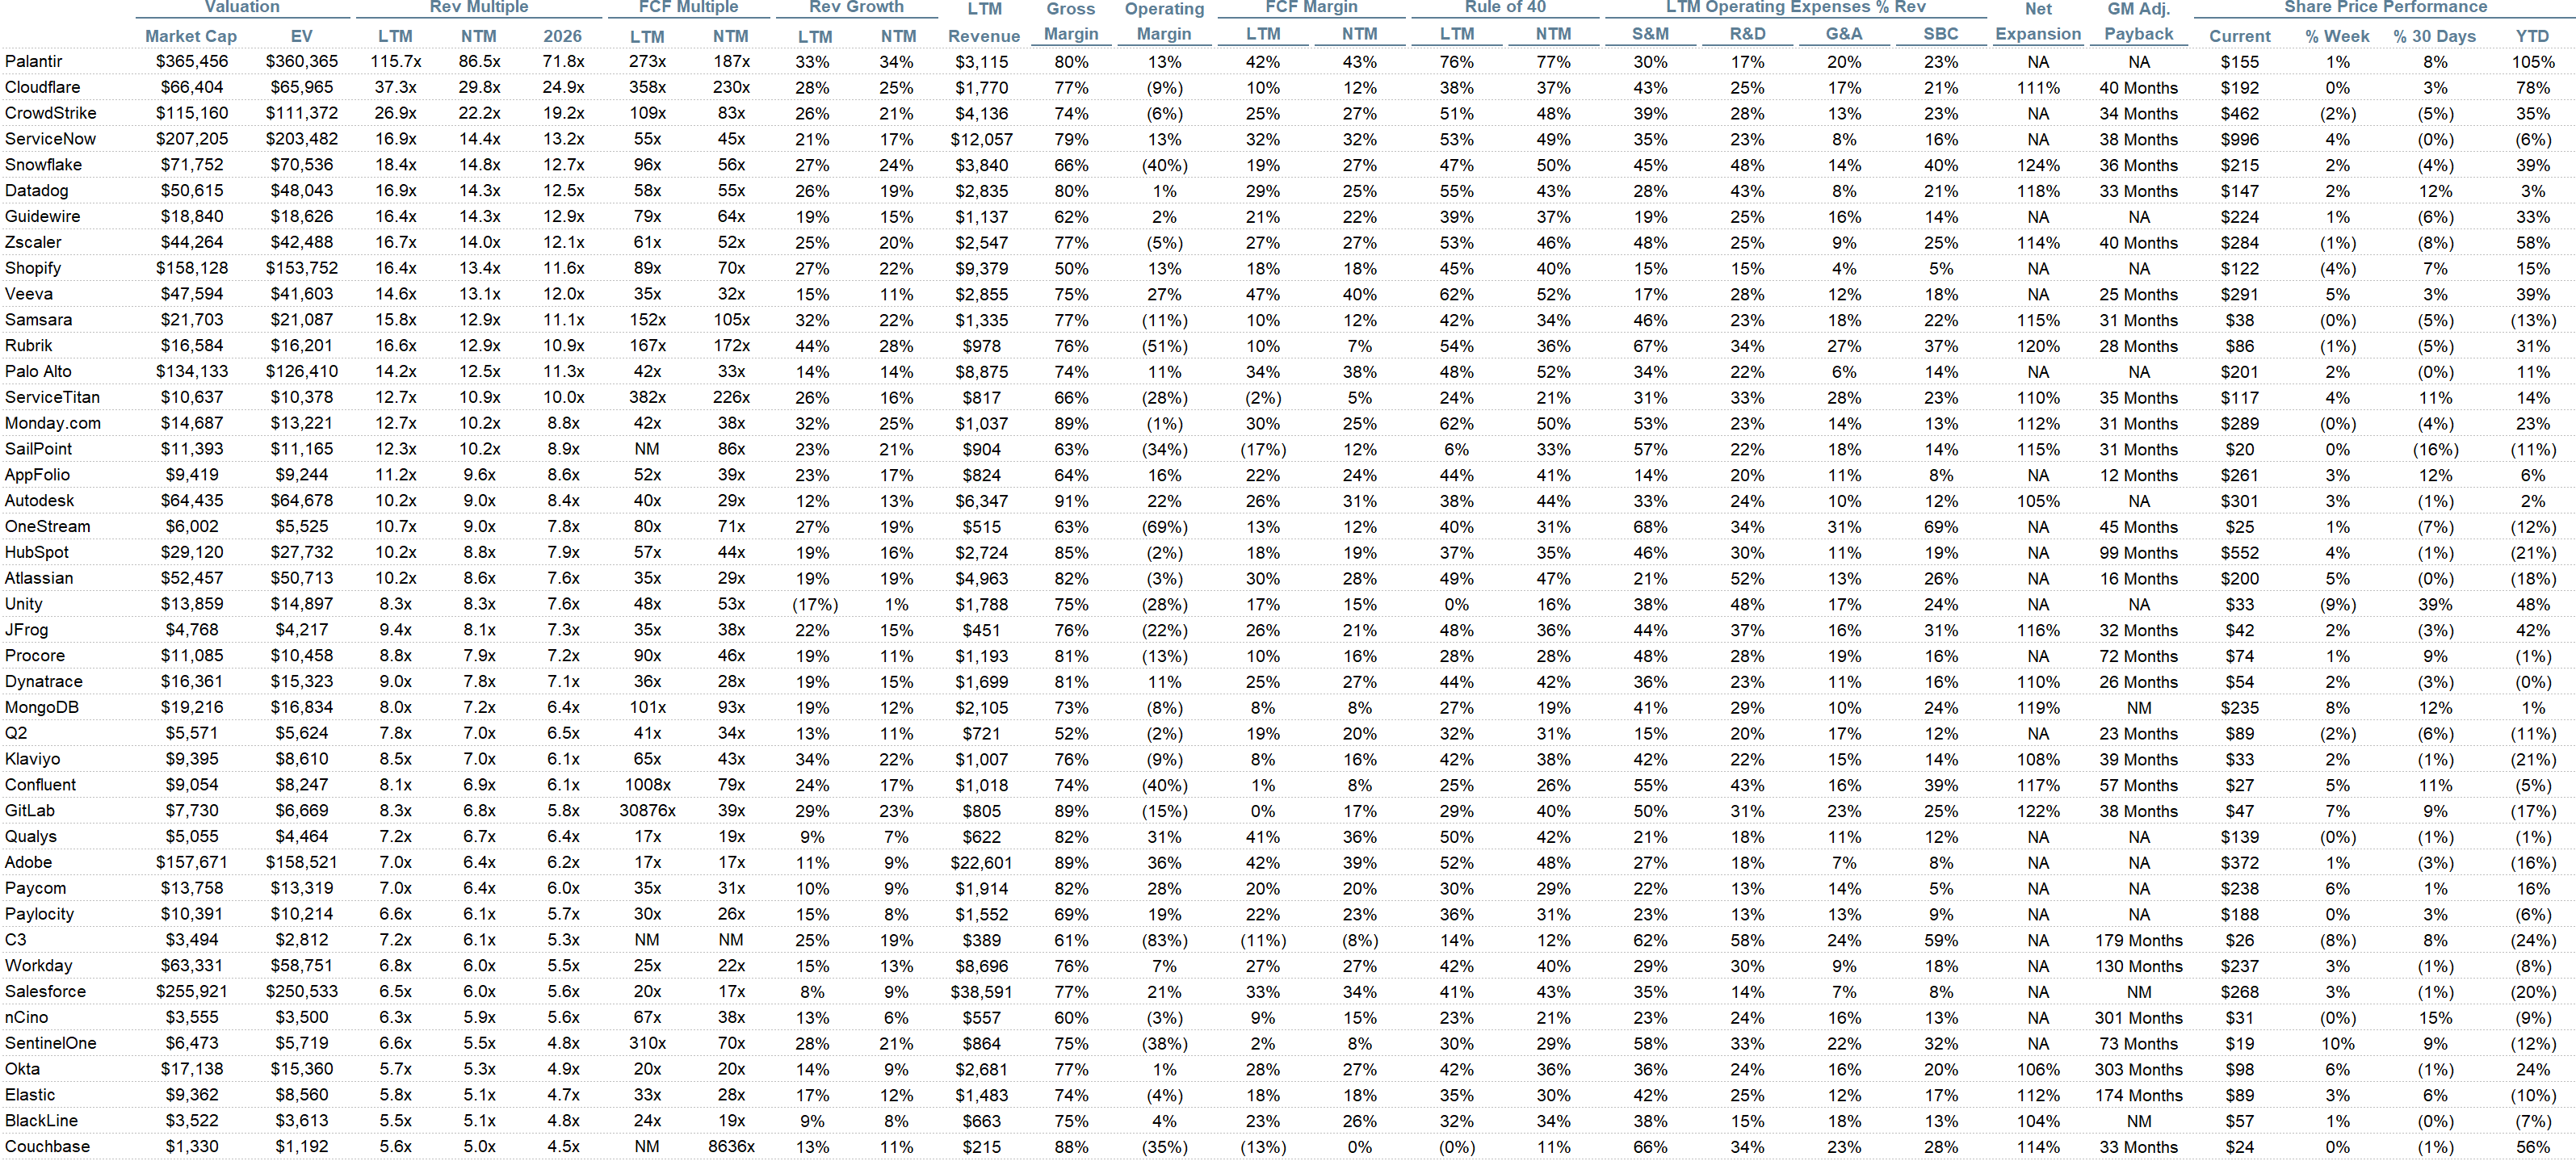
SaaS businesses are generally valued on a multiple of their revenue - in most cases the projected revenue for the next 12 months. Revenue multiples are a shorthand valuation framework. Given most software companies are not profitable, or not generating meaningful FCF, it’s the only metric to compare the entire industry against. Even a DCF is riddled with long term assumptions. The promise of SaaS is that growth in the early years leads to profits in the mature years. Multiples shown below are calculated by taking the Enterprise Value (market cap + debt - cash) / NTM revenue.
Overall Stats:
Overall Median: 5.7x
Top 5 Median: 22.2x
10Y: 4.4%
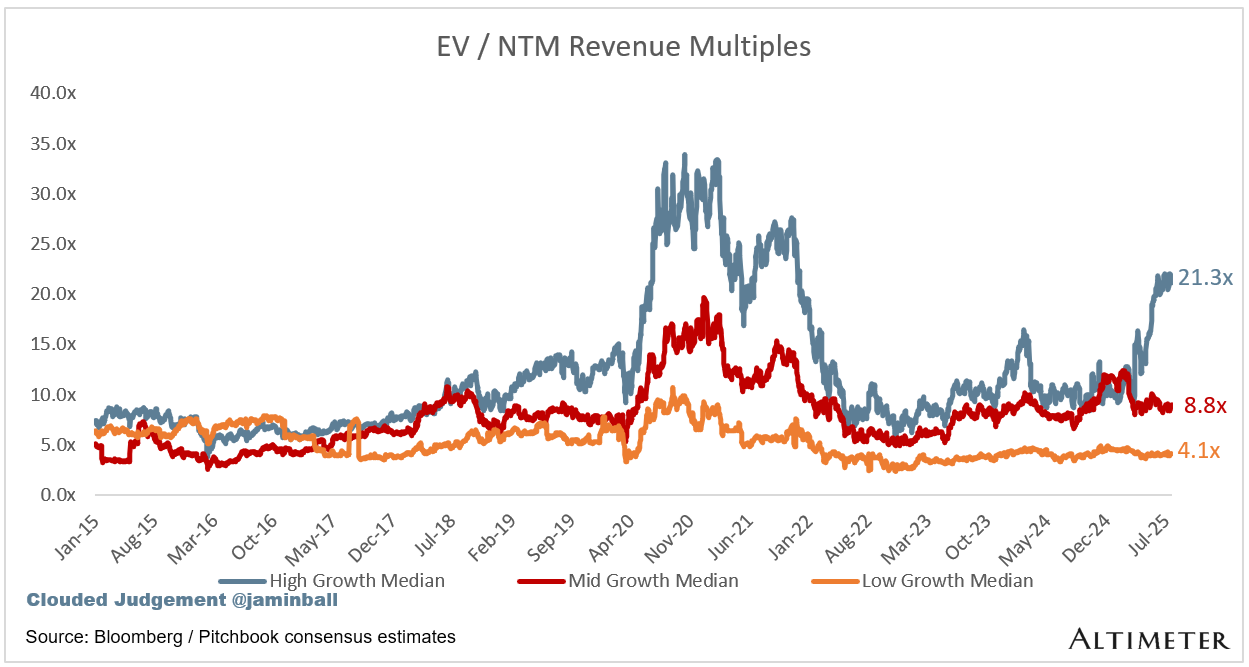
Bucketed by Growth. In the buckets below I consider high growth >25% projected NTM growth, mid growth 15%-25% and low growth <15%
High Growth Median: 21.3x
Mid Growth Median: 8.8x
Low Growth Median: 4.1x
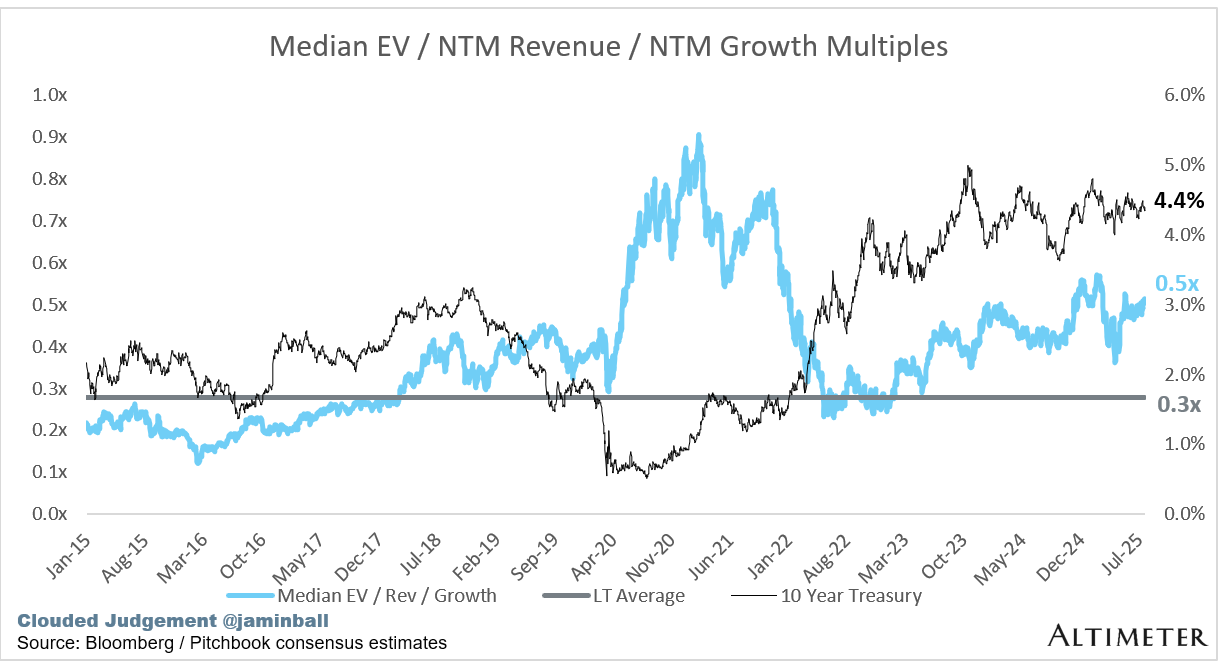
EV / NTM Rev / NTM Growth
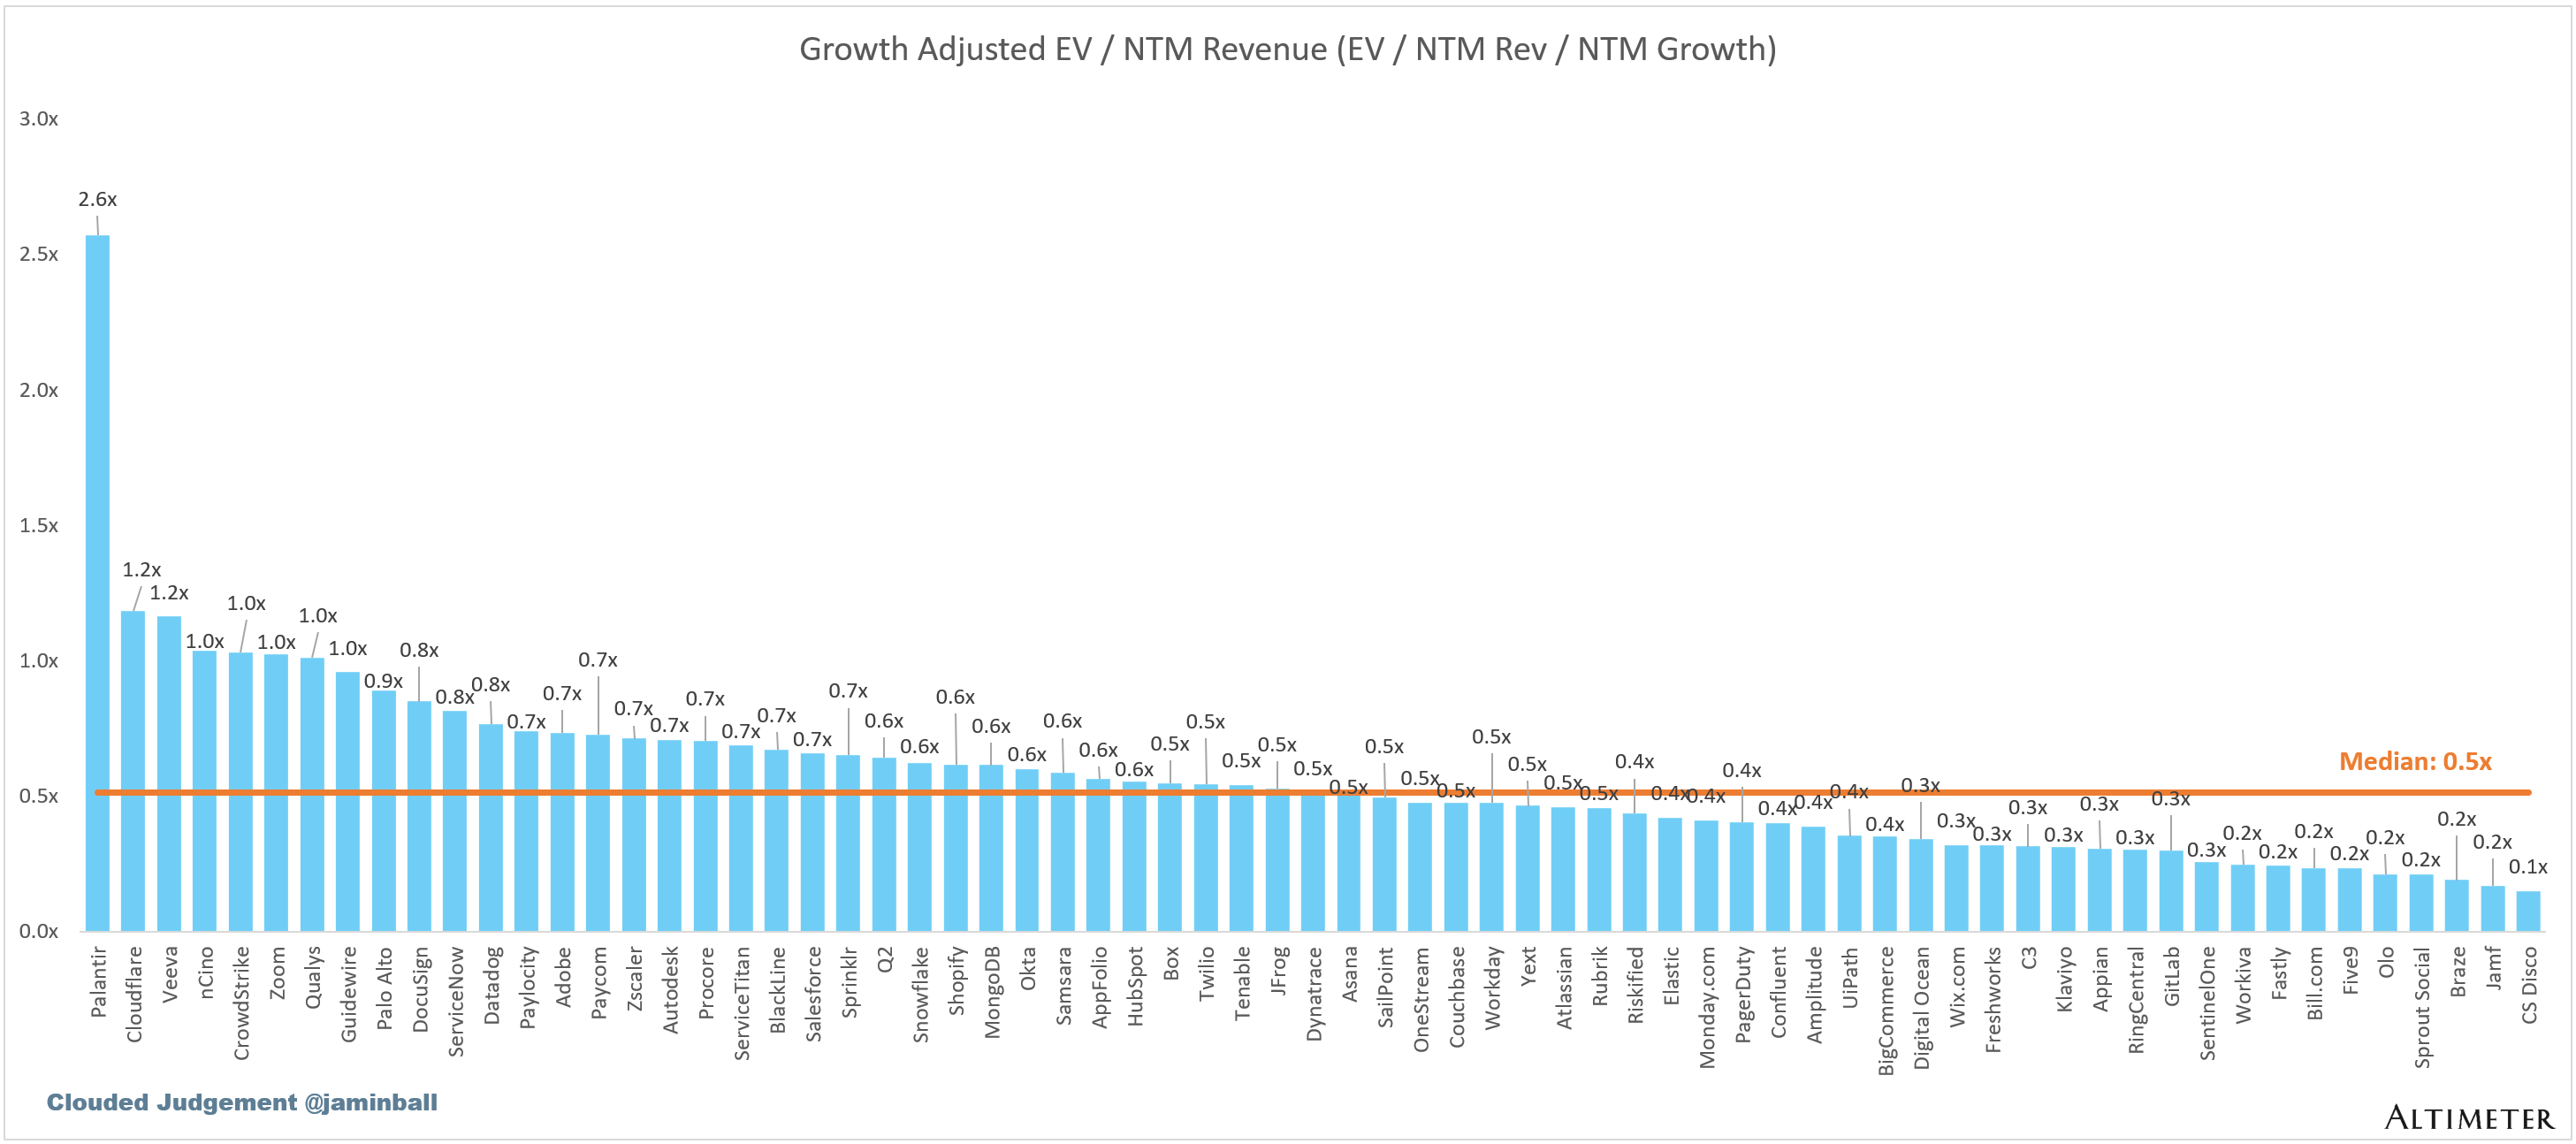
The below chart shows the EV / NTM revenue multiple divided by NTM consensus growth expectations. So a company trading at 20x NTM revenue that is projected to grow 100% would be trading at 0.2x. The goal of this graph is to show how relatively cheap / expensive each stock is relative to its growth expectations.
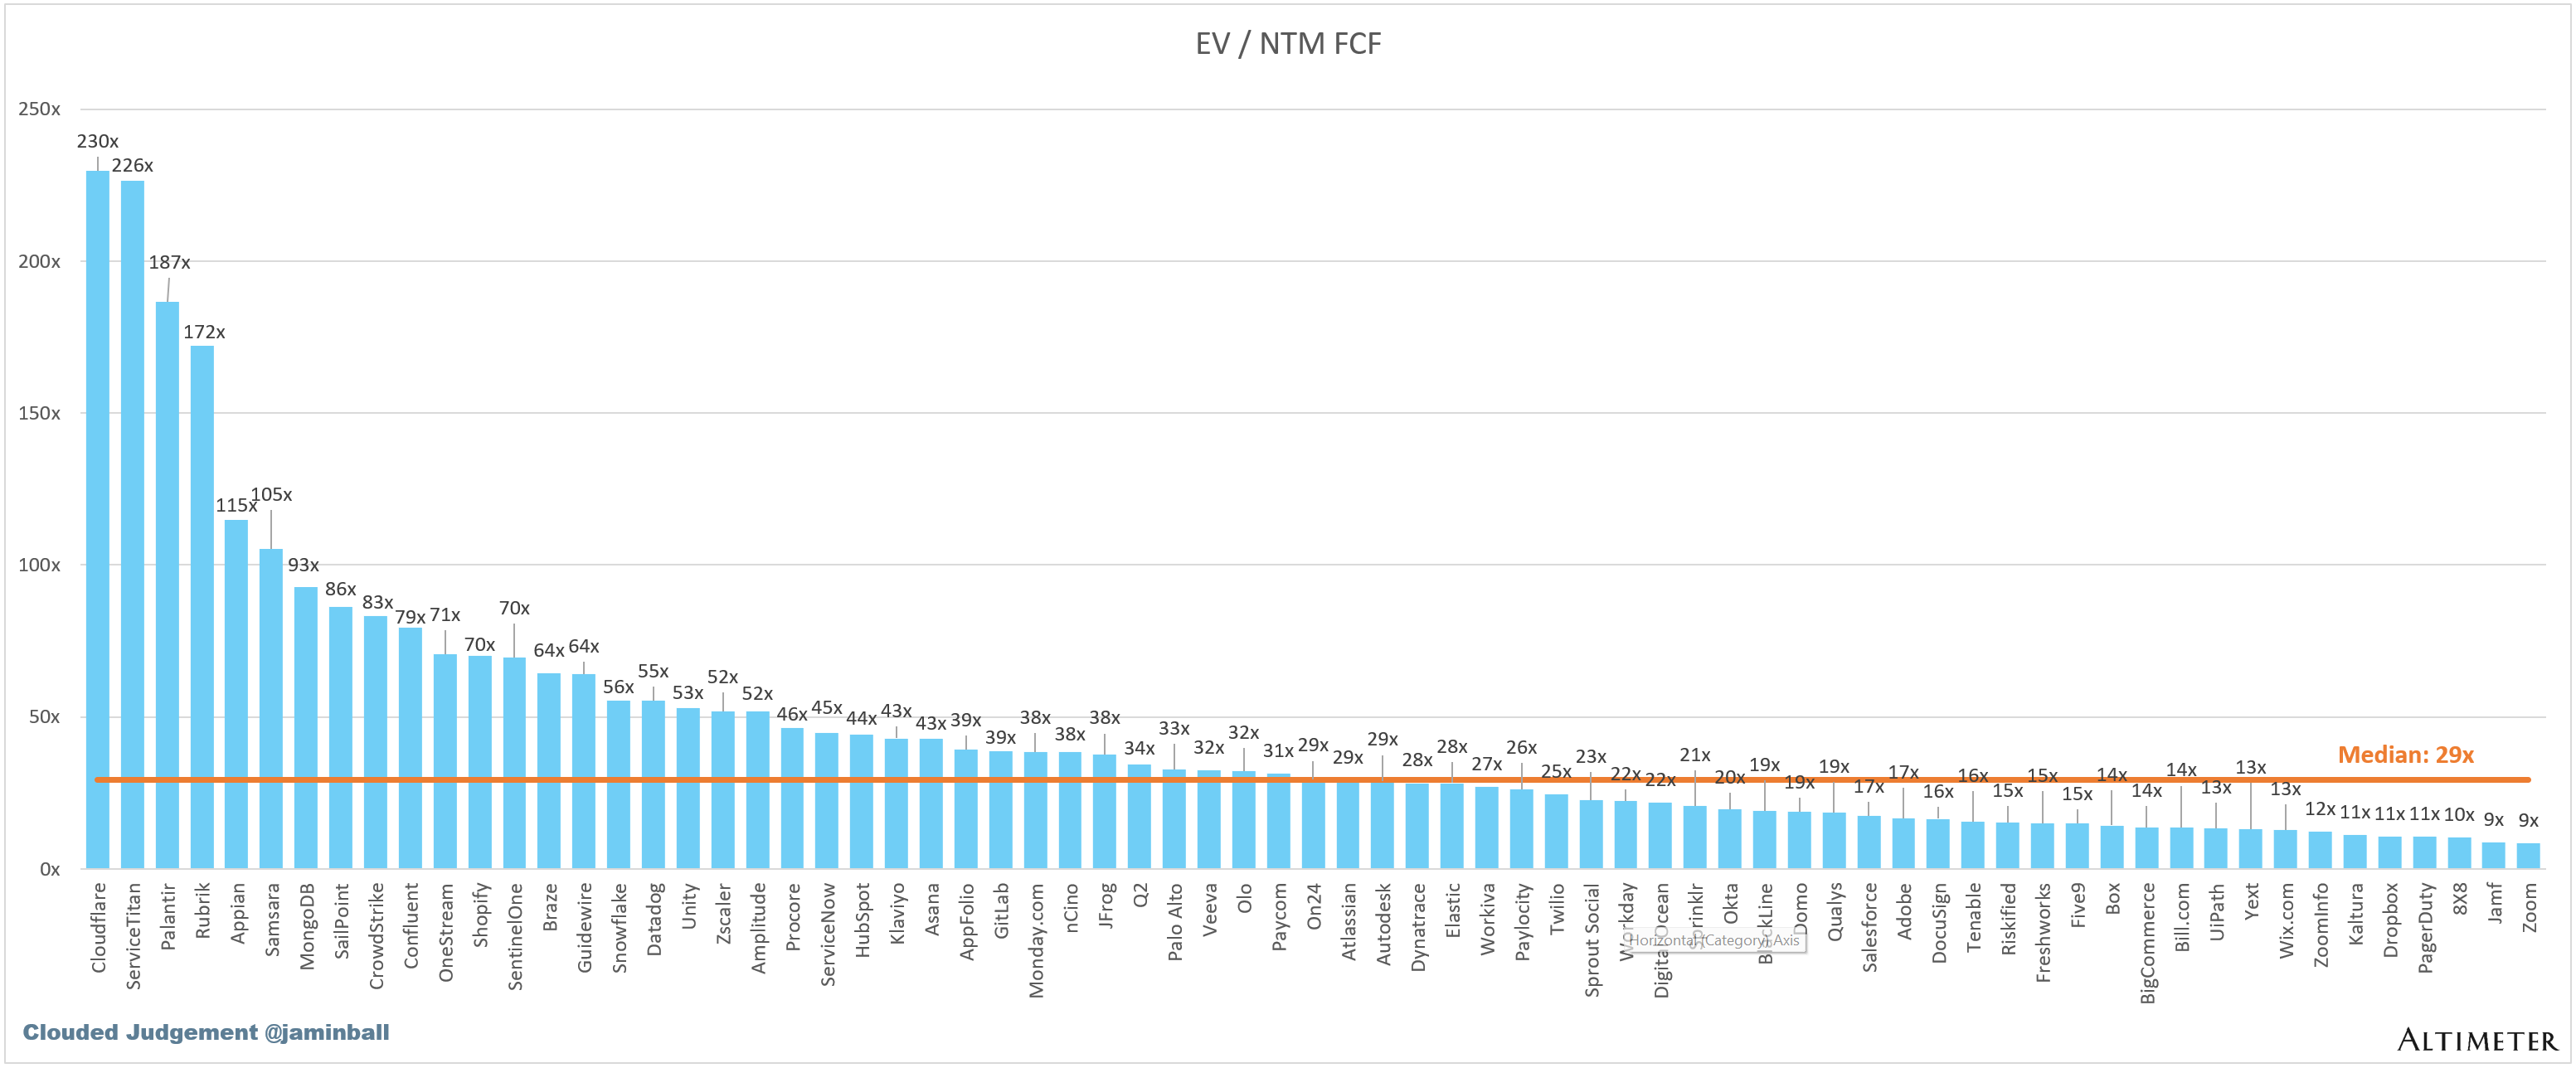
EV / NTM FCF
The line chart shows the median of all companies with a FCF multiple >0x and <100x. I created this subset to show companies where FCF is a relevant valuation metric.
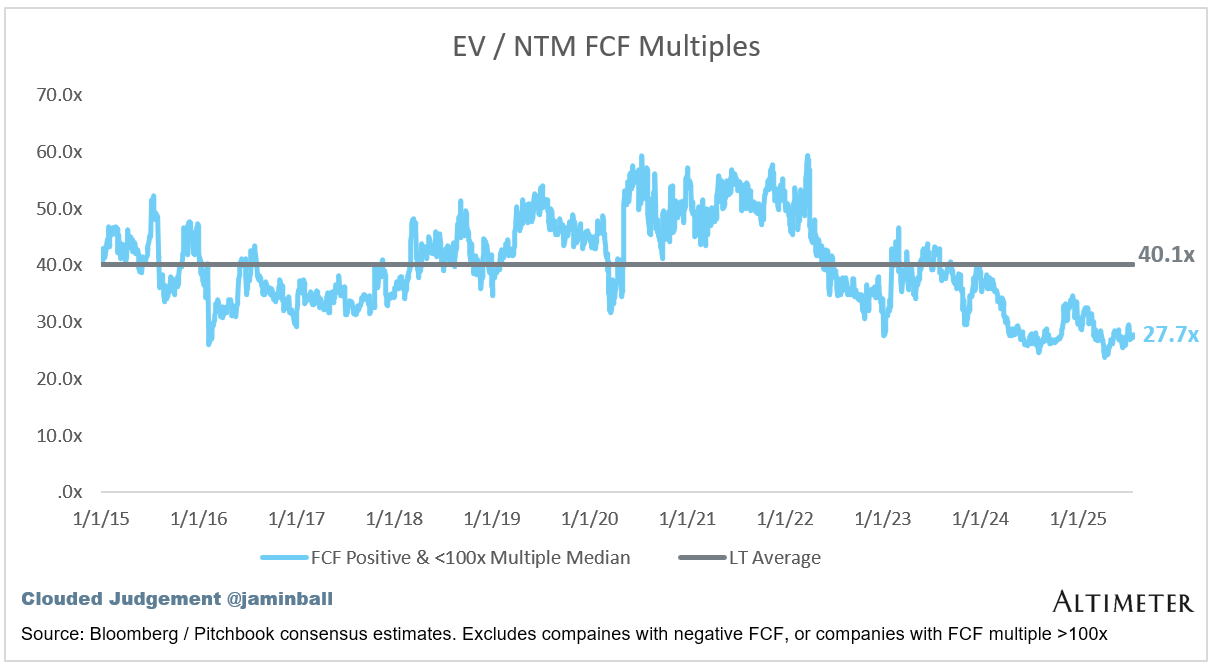
Companies with negative NTM FCF are not listed on the chart
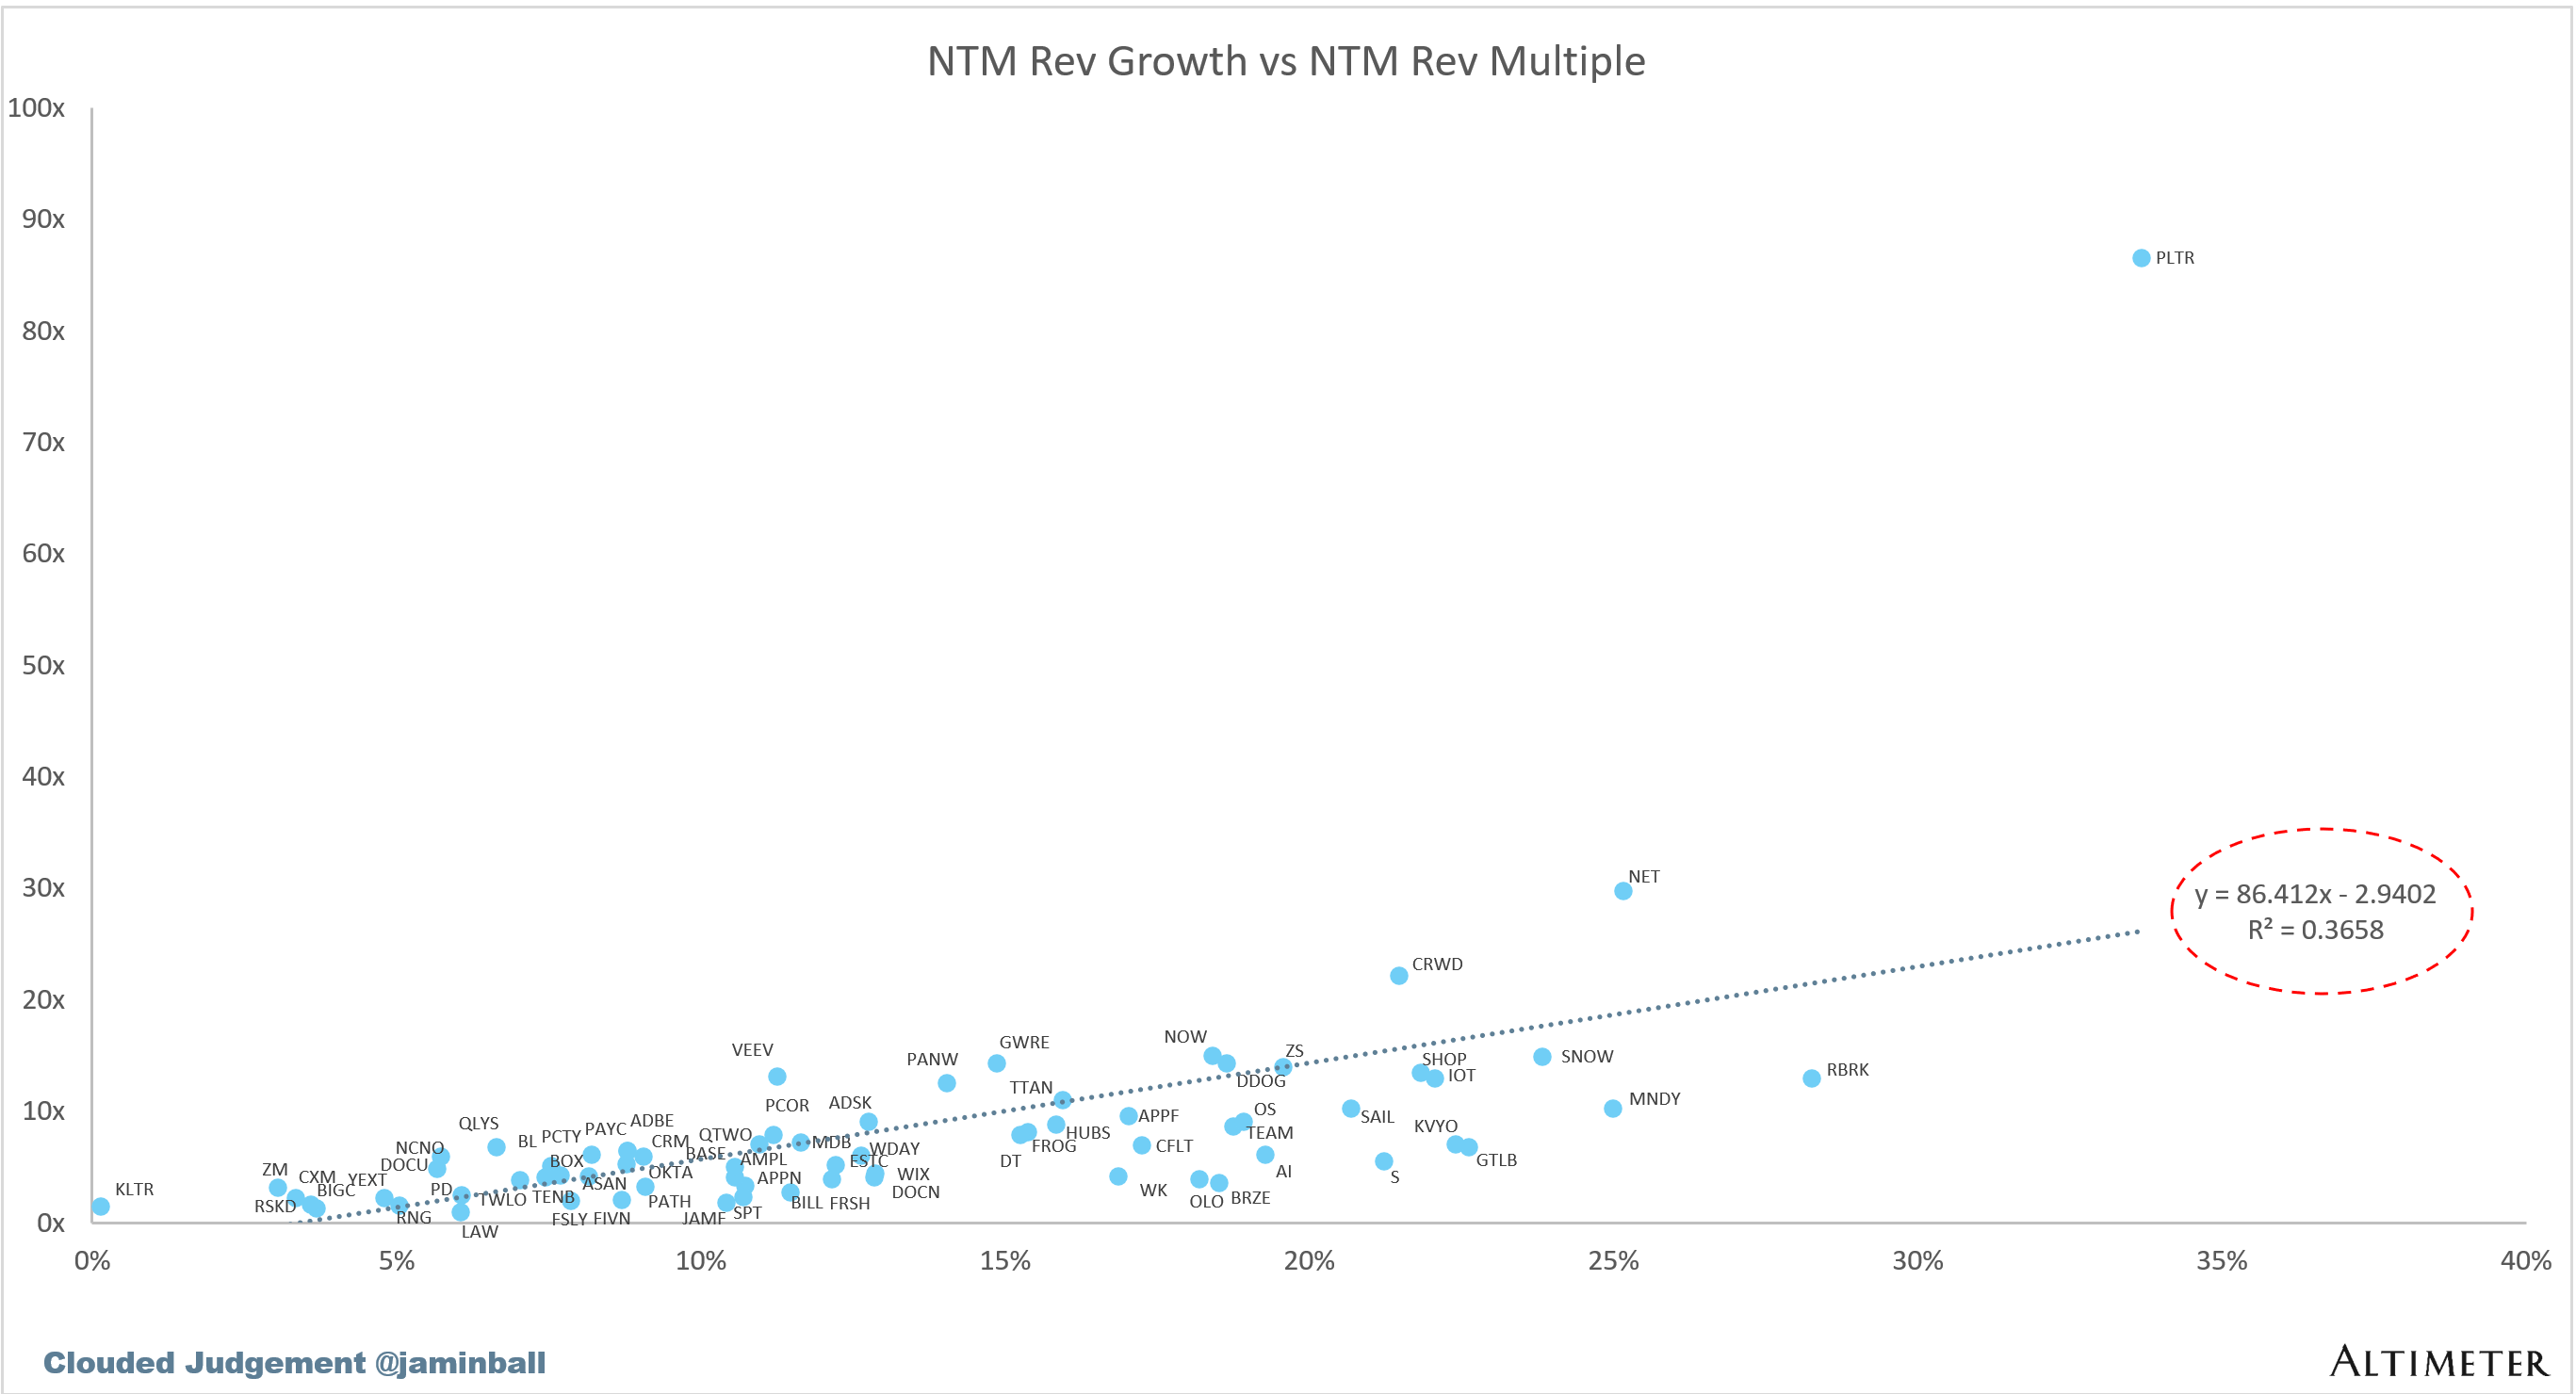
Scatter Plot of EV / NTM Rev Multiple vs NTM Rev Growth
How correlated is growth to valuation multiple?
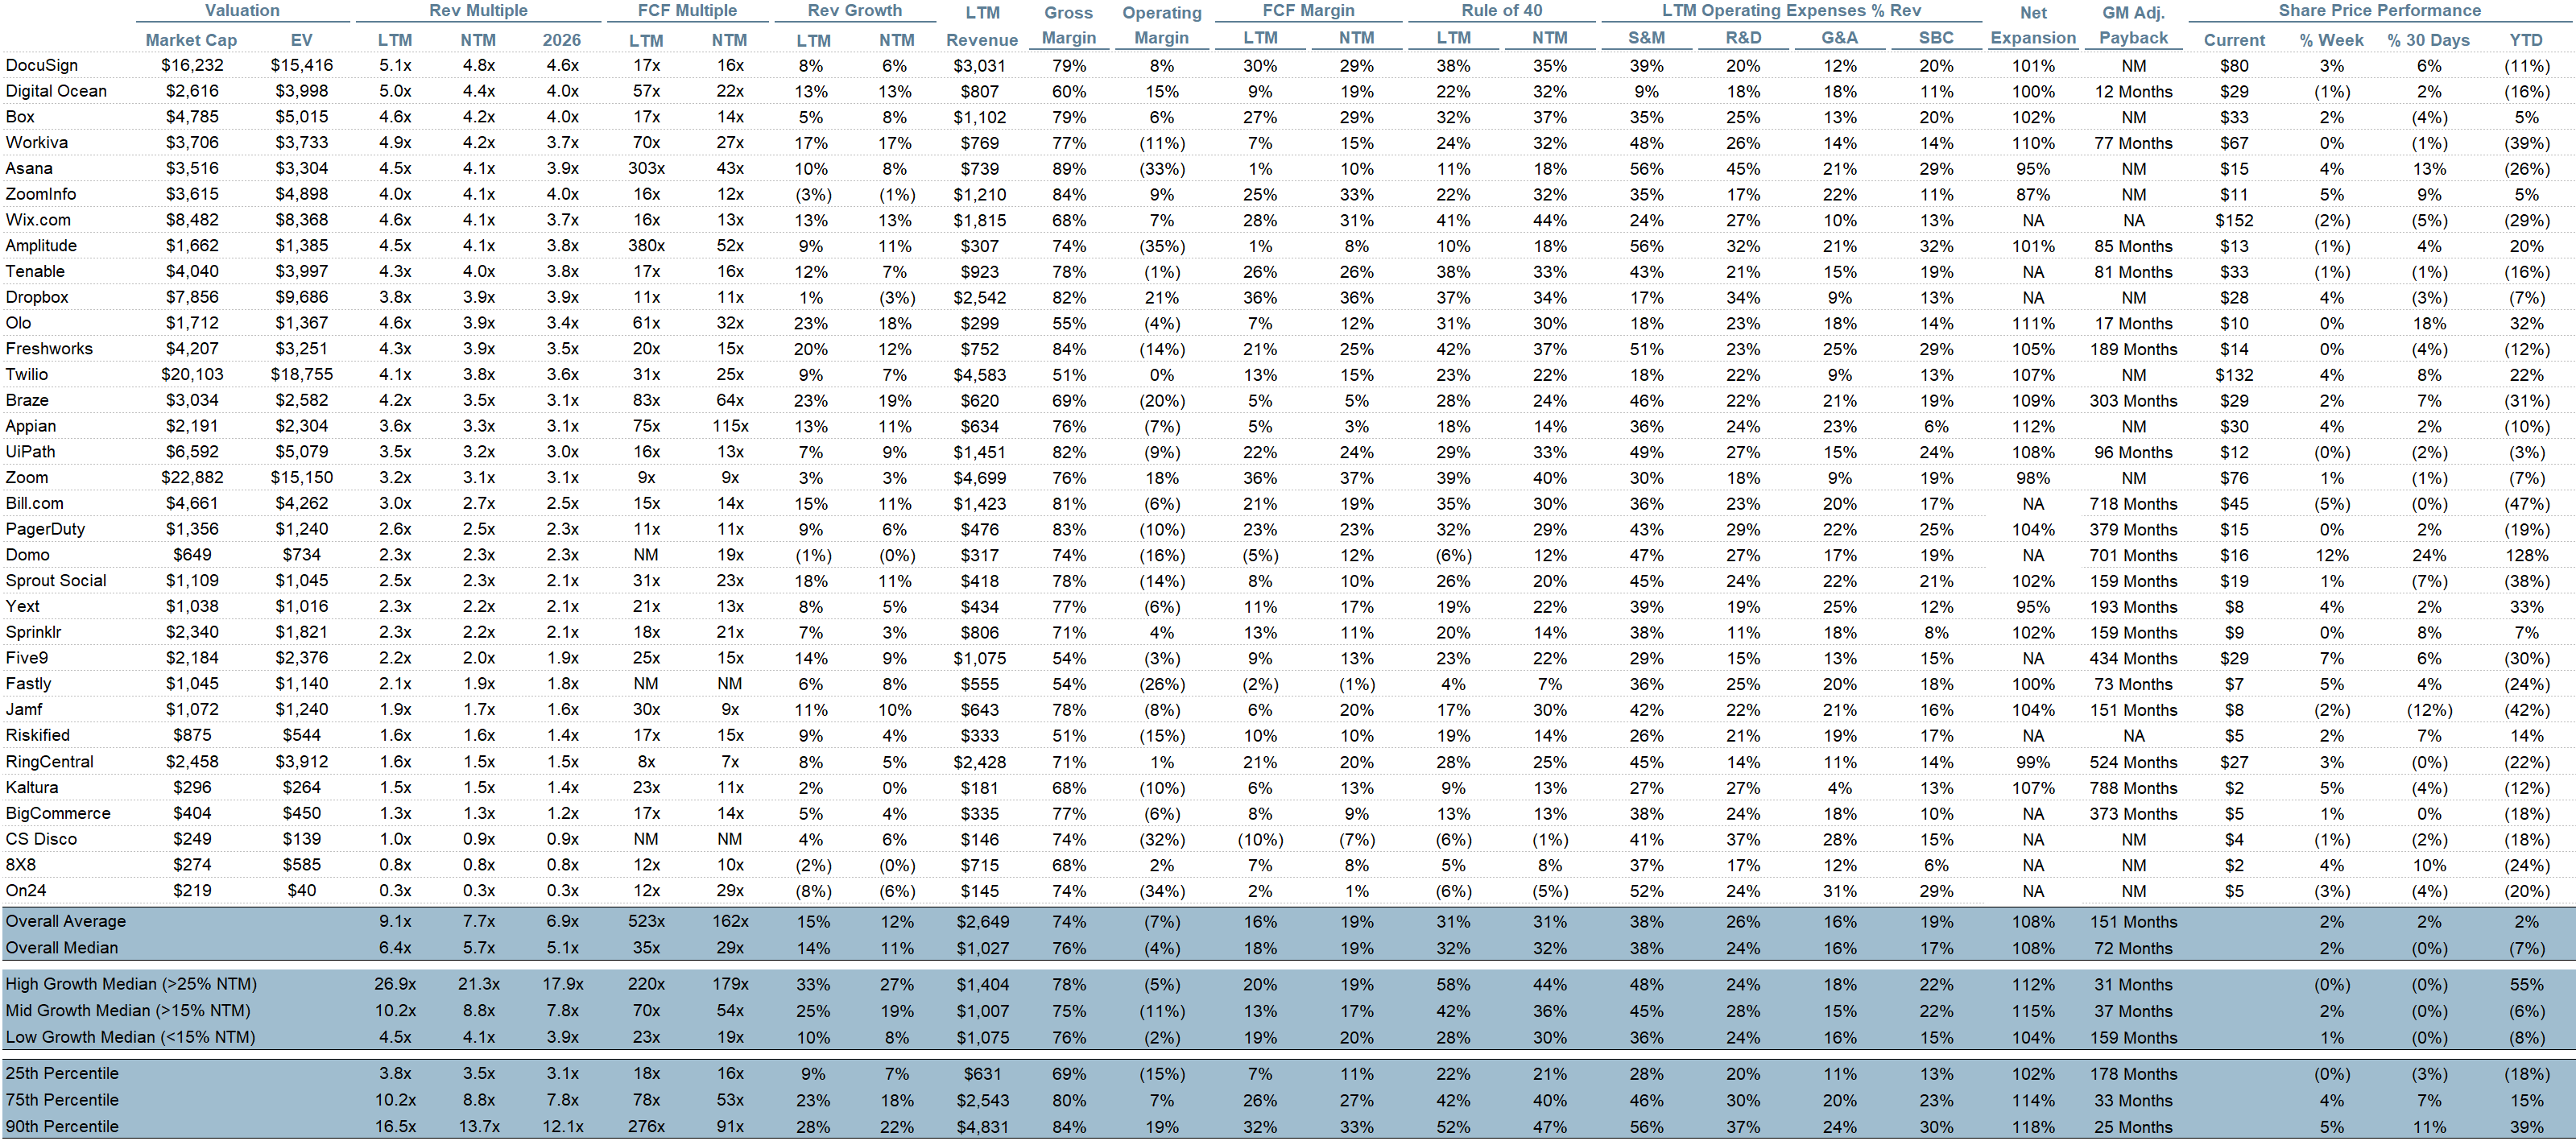
Operating Metrics
Median NTM growth rate: 11%
Median LTM growth rate: 14%
Median Gross Margin: 76%
Median Operating Margin (4%)
Median FCF Margin: 18%
Median Net Retention: 108%
Median CAC Payback: 72 months
Median S&M % Revenue: 38%
Median R&D % Revenue: 24%
Median G&A % Revenue: 16%
Comps Output
Rule of 40 shows rev growth + FCF margin (both LTM and NTM for growth + margins). FCF calculated as Cash Flow from Operations - Capital Expenditures
GM Adjusted Payback is calculated as: (Previous Q S&M) / (Net New ARR in Q x Gross Margin) x 12. It shows the number of months it takes for a SaaS business to pay back its fully burdened CAC on a gross profit basis. Most public companies don’t report net new ARR, so I’m taking an implied ARR metric (quarterly subscription revenue x 4). Net new ARR is simply the ARR of the current quarter, minus the ARR of the previous quarter. Companies that do not disclose subscription rev have been left out of the analysis and are listed as NA.
Sources used in this post include Bloomberg, Pitchbook and company filings
The information presented in this newsletter is the opinion of the author and does not necessarily reflect the view of any other person or entity, including Altimeter Capital Management, LP ("Altimeter"). The information provided is believed to be from reliable sources but no liability is accepted for any inaccuracies. This is for information purposes and should not be construed as an investment recommendation. Past performance is no guarantee of future performance. Altimeter is an investment adviser registered with the U.S. Securities and Exchange Commission. Registration does not imply a certain level of skill or training. Altimeter and its clients trade in public securities and have made and/or may make investments in or investment decisions relating to the companies referenced herein. The views expressed herein are those of the author and not of Altimeter or its clients, which reserve the right to make investment decisions or engage in trading activity that would be (or could be construed as) consistent and/or inconsistent with the views expressed herein.
This post and the information presented are intended for informational purposes only. The views expressed herein are the author’s alone and do not constitute an offer to sell, or a recommendation to purchase, or a solicitation of an offer to buy, any security, nor a recommendation for any investment product or service. While certain information contained herein has been obtained from sources believed to be reliable, neither the author nor any of his employers or their affiliates have independently verified this information, and its accuracy and completeness cannot be guaranteed. Accordingly, no representation or warranty, express or implied, is made as to, and no reliance should be placed on, the fairness, accuracy, timeliness or completeness of this information. The author and all employers and their affiliated persons assume no liability for this information and no obligation to update the information or analysis contained herein in the future.
Great points, Jamin. I totally agree about how traditional TAM analysis falls short for innovative SaaS companies. As a junior entrepreneurship enthusiast myself, I'm curious about the practical side of 'creating a new market.' What early signals or characteristics should founders look for that suggest their tool might be innovative enough to expand beyond existing market boundaries rather than just compete within them?